This describes how to monitor E1/T1 port fault seconds to know the transmission quality of the links on the E1/T1 port in real time.
Prerequisites
- The LMT runs normally.
- The communication between the LMT and the BSC is normal.
- All the interface boards are functional.
Context
The E1/T1 port fault seconds are listed in Table 1.
Name |
Meaning |
|---|---|
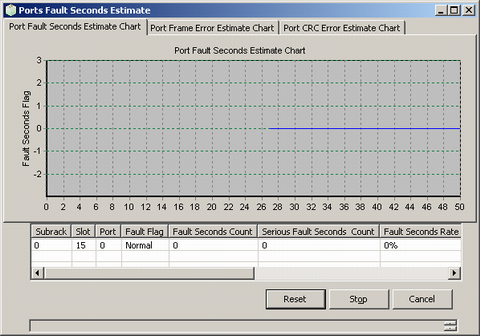
Fault |
Fault indicates the BER on the E1/T1 port. Value range: Normal, Serious Fault. |
Fault Seconds Count |
A second during which one or more than one block error is detected is called block error second. The fault seconds count refers to the number of block error seconds. |
Fault Second Rate |
The ratio of the fault seconds count to the total seconds of the measurement period. |
Serious Fault Seconds Count |
Block errors refer to the bit errors during the transmission. The serious fault seconds have the following features:
The serious fault seconds count refers to the total number of serious fault seconds. |
Serious Fault Seconds Count Rate |
The ratio of the serious fault seconds count to the total seconds of the measurement period. |
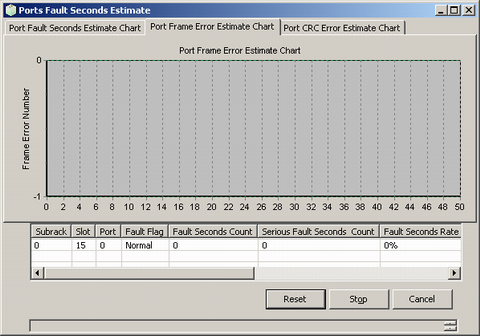
Frame Error Number |
Frame error number indicates the number of frame errors in a unit of time. |
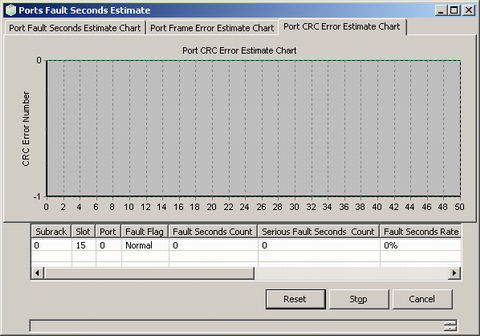
Crc Error Number |
Crc error number indicates the number of CRC check errors in a time unit. |
Procedure
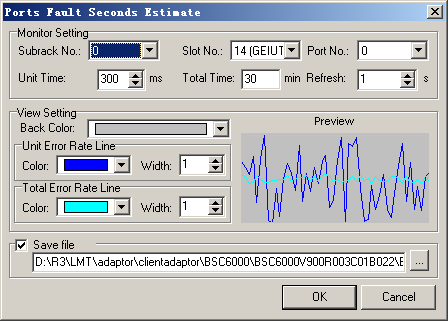
- On the Trace & Monitor tab page, choose . A dialog box is displayed, as shown in Figure 1.
- Set the parameters in the Monitor Setting and View Setting areas, and then click OK.
- Click Reset to reconfigure the parameters in Figure 2. Click Stop to stop the monitoring task. Click Cancel to quit the monitoring task.