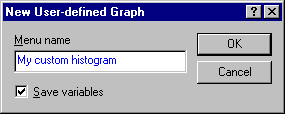
Click the Add as User-defined Graph to Menu button on the Options 2 tab of all Graphs menu graphs to display the New User-defined Graph dialog. Here, you can save the options, selections, and variables for the current graph as a user-defined graph; these user-defined graphs can be called as "templates" or shortcuts by selecting the Graphs menu User-defined Graphs options.
Menu Name. Enter here the name (up to 40 characters) that will be used to identify the user-defined graph on the Graphs menu. For example, suppose you called the new graph My custom histogram.

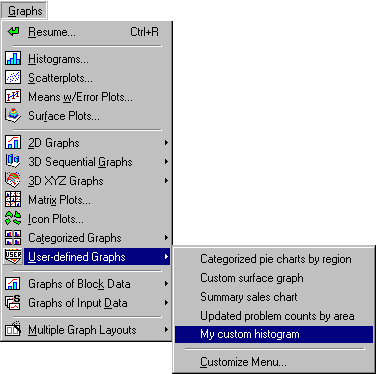
After clicking OK, this type of graph (and all settings chosen on the other tabs for this histogram) will be available as a User-defined graph on the Graphs menu:

Use the Customize Menu option to edit the list of user-defined graphs that you want to be available here.
Save variables. When this option is selected on the New User-defined Graph dialog, the variable selections (i.e., variable numbers) will be saved as part of the graph definition in the user-defined graph. When the user-defined graph is later called up, the previously-selected variables will be displayed in the respective specifications dialog.