![]() From the Help
- Animated
Overviews menu, select How
To: Select General Categories of Graphs to view a brief video
about of Graphs of Input Data
and Graphs of Block Data.
From the Help
- Animated
Overviews menu, select How
To: Select General Categories of Graphs to view a brief video
about of Graphs of Input Data
and Graphs of Block Data.
The Select Graph dialog is displayed when one of the four custom graphs options is selected from the Graphs - Graphs of Block Data menu. Depending on which custom graph option was used (or the creation method specified in this dialog), the custom graph(s) will be created either for the block of values highlighted in the current spreadsheet (by row or column) or for the entire column or row represented in the selected block. Here you will specify the graph category, type, and subtype to use. Once you have specified what graph to create, click OK, or click Cancel to return to the spreadsheet without creating any graphs. To see additional options for multiple plots and creation methods, click the More button. For more information on Graphs of Block Data, see the Graphs of Block Data Overview.
Select Graph Category. Select from five categories of Stats Graphs: 2D Graphs, 3D Sequential Graphs, 3D XYZ Graphs, Matrix Graphs, or Icon Graphs.
Select
Graph Type and Select Graph SubType. Depending on the graph category
you have chosen, you can choose from a variety of graph types and, in
some cases, graph subtypes. For more information on the graph types and
subtypes within a given category, click on the links below.
|
|
Note that additional graph categories, types and subtypes are available via the Stats Graphs facilities accessible from the Graphs menu.
Layout for Multiple Plots. When more than one row or column is included in your selection, you can decide how you want to plot each row or column. To plot each row or column in a separate graph window, select Separate Windows. To plot all rows or columns in a single graph window, select Single Window (Overlaid). This option is only available when the More button has been clicked.
Data. The options in this group box can be changed only when this dialog is displayed ("called") from the Customize Graph Menu dialog; if it is displayed directly while creating a particular graph interactively from a block of data (i.e., via option Graphs of Block Data - Custom graphs... after selecting a block of data in a spreadsheet) then the setting of the respective option in this group is determined by your specific choice of the Custom Graph (from Block by Column, by Row; for Entire Column, for Entire Row).
In other words, these options apply to the case when you are creating
a new user-defined custom graph ("template") or editing an existing
user-defined custom
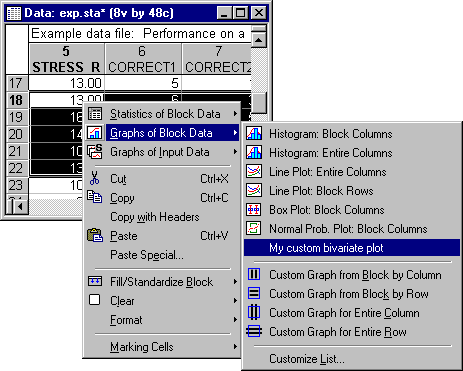
Add to Graph menu List. Use this option to save the choices made on this dialog as a "template" to the list of graphs that can be selected for blocks of highlighted data. For example, suppose you created a scatterplot with histograms for the selected block of data. If you set this checkbox and then click OK to produce the graph, the New Style dialog will be displayed where you can type in a name for the new type (style) of graph from block data. Suppose you name it My custom bivariate plot. The next time you want to make a graph of block data, you can simply select this type of plot from the Graphs of Block Data menu:

Use the Customize List option on this menu to edit or delete custom options from the Graphs of Block Data menu.
Enable Prompt for Dialog. This option is applicable only if you select the Add to Graph menu List check box (described above). If the Enable Prompt for Dialog check box is selected when the new custom graph menu list item was created, then after selecting the respective new custom graph type (e.g., option My custom bivariate plot in the example above), the standard Select Graph dialog (described here) will be displayed with the respective options preselected. If you want the graph to be created (after you choose the new option from the Graphs of Block Data menu) without any further prompting, clear the Enable Prompt for Dialog check box before creating the new custom graph option.