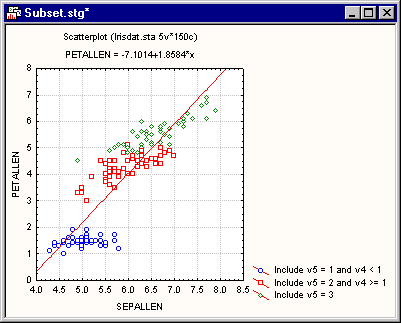
When you click the Specify Multiple Subset button, the Specify Multiple Subsets dialog is displayed, in which you can specify selection conditions that will subset (i.e., categorize) the cases in the plot. After you define the subset conditions, STATISTICA assigns the points in the plot that satisfy the first condition a point marker that is different from those given to the points that satisfy the second condition, etc.
For example, cases that satisfy the conditions given in the categories below,
Subset 1: Include if: v5 = 1 and v4 < 1
Subset 2: Include if: v5 = 2 and v4 >= 1
Subset 3: Include if: v5 = 3
will be assigned the following point markers: category 1 will be assigned a circle point marker, category 2 will be assigned a square point marker, and category 3 will be assigned a diamond point marker. The text of these conditions along with the appropriate point marker will become the plot legend so that you will be able to easily discern between categories in the graph.

The default selection of point markers used to identify the marked cases (subsets) of points can be adjusted in the Documents/Graphs: Display options pane in the Options dialog (accessible from the Tools menu). For more information on selection conditions for subsetting cases, see Specify Multiple Subsets.
Note that overlaid Categorized Scatterplots automatically mark the points in each overlaid plot differently (i.e., each plot is represented in the same manner as multiple subsets which are based on categorization options). Use the overlaid format of Categorized Scatterplots when you need to treat each subset as a separate plot in the graph (e.g., in order to fit a separate function to each subset). Use the Mark Selected Subset option in the regular Scatterplots if you intend to include all subsets in one plot (e.g., in order to be able to fit one function to combined data from all subsets).
See also, Exploratory Data Analysis and Data Mining Techniques.