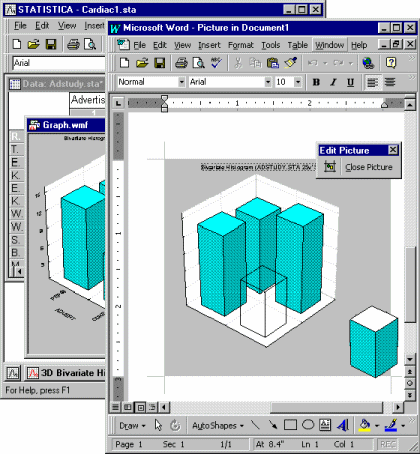
The metafile format, also referred to as Picture (a standard Windows graphics format used in Clipboard and disk file representations of graphs; file name extension *.wmf) stores a picture as a set of descriptions or definitions of all components of the graph and their attributes (e.g., segments of lines, colors and patterns of those lines, specific fill patterns, text and text attributes, etc.).
Therefore, as compared to bitmaps (another standard Windows graphics format, see below), metafiles offer more flexible options for non-OLE modification and customization in other Windows applications.
For example, when you open a metafile in the Microsoft Draw program, you can "disassemble" the graph: select and modify individual lines, fill patterns, and colors; edit text and change its attributes, etc.

Note, however, that not all Windows applications support the complete (extended) set of metafile graphics features and attributes supported and used by STATISTICA, thus some aspects of STATISTICA Graphs (saved as metafiles) will look different when they are opened in such applications (e.g., rotated and transformed fonts can appear unrotated). For best results, copy STATISTICA Graphs to other applications using OLE conventions that allow you to invoke STATISTICA to customize or modify STATISTICA Graphs pasted into documents of other applications.
Note: The Create Clipboard/Report/Metafile images at a printer resolution option is located in the Documents/Graphs: Display options pane in the Options dialog, the Documents/Reports options pane in the Options dialog, and the Analyses/Graphs: Output Manager options pane in the Options dialog (accessible from the Tools menu). This option determines the line thickness for rendering the main components of the graphs used when generating metafile representations of STATISTICA Graphs. Metafile representations are created for the Clipboard when STATISTICA Graphs are pasted as metafiles (and not as STATISTICA active objects) to other applications, such as MS Word. They are also used when STATISTICA Reports are printed or exported as RTF documents, and when you save STATISTICA Graphs in the metafile (.wmf) format in order to edit them as vector images in other programs.
In most typical applications, leave this option selected (i.e., set at low resolution, the default setting) in order to create directly printable representations of STATISTICA Graphs in other programs. Note that, depending on the resolution of your display, these images may not look as "clean" on the screen as when this option is cleared (i.e., when high resolution metafiles are generated). In the latter case, however, the metafiles will be generated using high resolution rendering that, on most high-quality printing devices, will create output with too thin lines (e.g., with a single device pixel lines on a 1200 DPI printer).
Note that this option does not affect the quality of graphs saved/printed as STATISTICA Graphs files/objects, where the precise translation of the requested line thickness into printed or displayable resolution is not limited by compatibility concerns resulting from using the metafile (.wmf) representation.