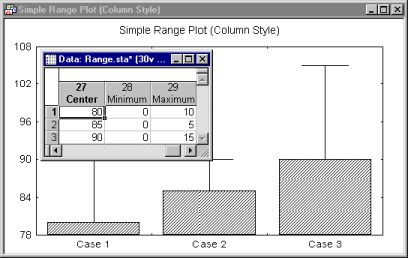
Graphs menu graphs range plots display ranges of values or error bars related to specific data points in the form of boxes or whiskers. Unlike the standard box plots, the ranges or error bars are not calculated from data but defined by the raw values in the selected variables.
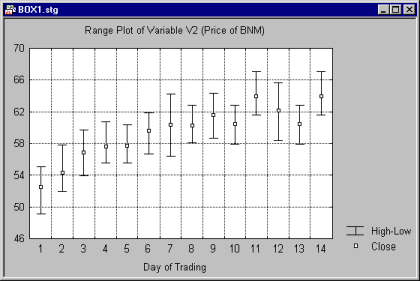
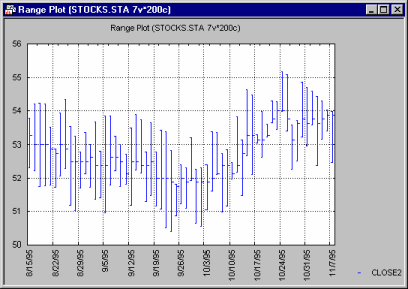
One range or error bar is plotted for each case or observation. In the simplest instance, three variables need to be selected, one representing the mid-points, one representing the upper limits and one representing the lower limits, as illustrated in the example below:

Range graphs are used to display (a) ranges of values for individual units of analysis (items, cases, samples, etc.); (b) variation of scores in individual groups or samples (this is applicable when the measures of variation are obtained from independent measurements; otherwise the box plots, which calculate the variation for the samples represented in the graph are more appropriate);
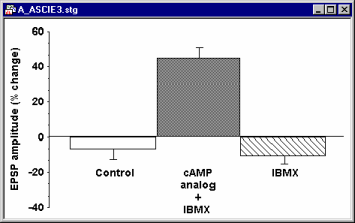
and (c) time spans or value ranges of independently measured phenomena, processes, or actions (e.g., advertising schedules). The major difference between the range and box plots is that in the range plots, all values that define the ranges ("middle points," minimum, and maximum) are not computed from the data but are provided as raw values of data variables.
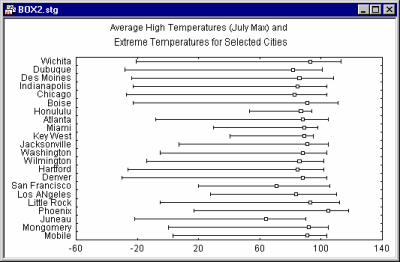
Typically, horizontal range plots are used to display time span data rather than variation data; they are also recommended when the range labels are very long, because in horizontal range plots the range labels do not have to be rotated (as is the case when long labels are used on the x-axis).
Vertical range plots are often used to represent market data, trading ranges, etc.
"One-sided" Ranges or Error Bars in Range Plots
For some applications, it is necessary that the range (or error) bar extends in only one direction.
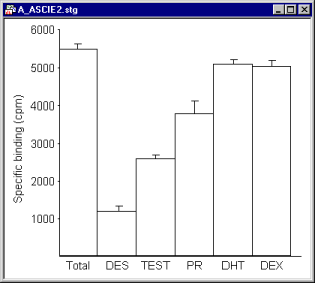
In order to display a "one-sided" range (relative to the mid-point) or an error bar which extends in only one direction, set the respective values of the variable defining the range boundary to 0 (when the Relative to the Mid-point mode is selected) or the mid-point (when the Absolute mode is selected). See the 2D Range Plots - Quick tab for more details.
