Contour plots are created by fitting a 3D surface function to a 3D scatterplot; the resulting surface contours (i.e., lines of identical "altitudes") are then projected onto the X-Y plane. Like Surface Plots, contour plots are used to examine relationships between three variables in the plot.
STATISTICA offers several types of surface functions that can be fit to the data (see 3D Graph Surfaces) using the integrated graphics facilities. They range from the simple linear surface function to functions that will "smooth" the data and approximate a surface at a given level of stiffness (e.g., distance-weighted least squares, negative exponential smoothing, etc.).
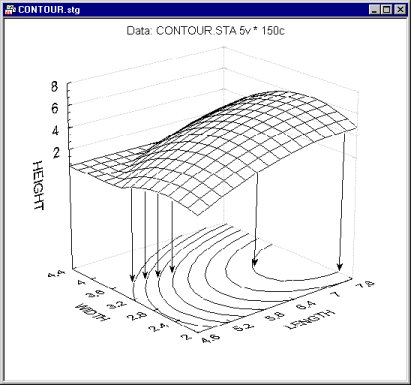
Those more complex surface-fitting methods can be particularly useful in order to uncover complex (interactive), non-linear, and non-monotonous relationships between the variables.
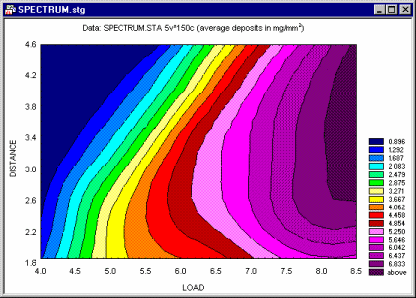
The Nonlinear Estimation) module offers specialized facilities to fit user-defined functions.
Applications
Contour Plots can be used in exploratory data analyses (such as those mentioned in the sections on 3D scatterplots and surfaces).
Also, they are useful to visualize results from analyses, such as custom function fitting (via Nonlinear Estimation) or Cluster Analysis. As compared to surface plots, they may be less effective to quickly visualize the overall shape of 3D data structures, however, their main advantage is that they allow for precise examination and analysis of the shape of the surface (contour plots display a series of undistorted horizontal "cross sections" of the surface).
A common application of the contour plot in the context of industrial statistics is to visualize the results of a central composite design experiment (see Experimental Design).
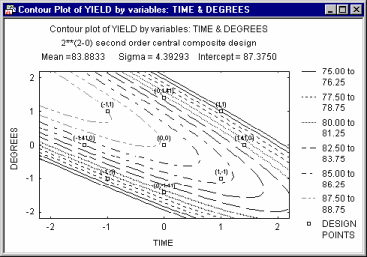
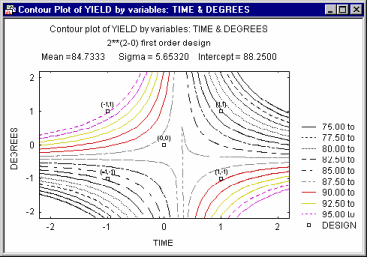
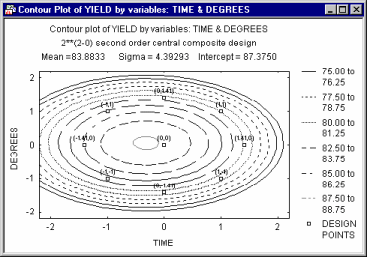
There, specific systematic values of two (or more) variables are set by the experimenter, to evaluate the effect of those variables on some dependent variable of interest (e.g., strength of a synthetic fabric). In many cases, complex non-linear relationships between variables emerge in such experiments.