The Missing and 'Out of Range' Data Plots are used to examine the pattern or distribution of missing and/or user-specified "out of range" data points in the current data set (or in a subset of variables and cases).
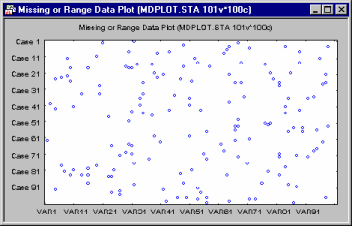
This graph is useful in exploratory data analysis to determine the extent of missing (and/or "out of range") data and whether the patterns of those data occur more or less at random:

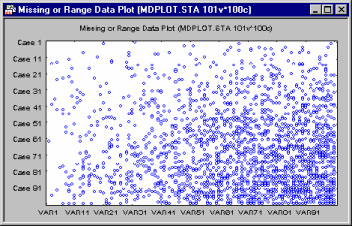
or they form an identifiable pattern:

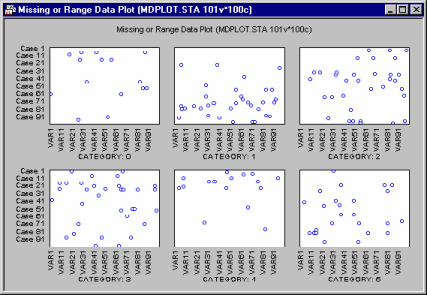
In a sense, they depict a "map" of a data file (or its segments) and allow you to examine patterns of missing data, particularly low values, high values, etc. The categorized format allows you to compare such patterns between particular subsets of data.

Note that a variety of methods are available in STATISTICA to transform and recode data (e.g., spreadsheet formulas or STATISTICA Visual Basic) including menu-driven techniques to replace or convert missing values. In most analyses, missing data can be managed using either pairwise deletion or casewise deletion of missing data, or substitution by means.