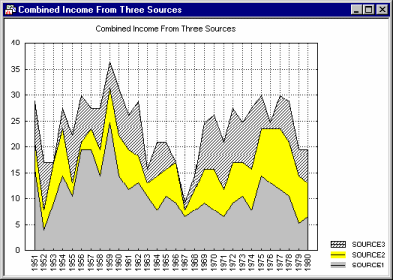
Sequential/Stacked Plots are used to present sequences of values. In this respect, the way in which they visualize data is similar to line plots. In fact, as long as you select only one variable to be plotted, the graphical representation of data will be identical to the one offered by line plots, although the specific graphical representations of data offered by the current graphs are more differentiated (e.g., line plots, area charts, step charts, bar charts, etc.).
The only major difference between the representation of data in those graphs as compared to line graphs appears when you select more than one variable to be plotted. In line plots, each of them would be plotted independently from the others; thus, for example, if two variables have the same values for case number 3, at this point (case 3) the two lines will cross or overlap. However, all graphs in the current category "stack" corresponding values of consecutive variables (from the selected list).

Thus, in this example, the point representing case number 3 in the second variable will be respectively higher than in the first variable. The variables are stacked in the order in which they were selected.
Due to this stacked representation of values in consecutive variables, the lines (or steps, areas, columns, etc.) of consecutive variables will never overlap as long as they are larger than 0.
This interpretation of data involves a limitation concerning missing data in the plotted data set. Specifically, the graph location of each data point in each consecutive variable (from the selected list) is calculated as a sum of its value and the corresponding values (i.e., those for the same case) in all "preceding" variables in the list. Therefore, if any of those preceding values are missing, then the sum cannot be calculated and the graph will be "broken" at this point. Thus, there should be no missing data in the data sets selected for the stacked representation (except for the last variable).
Applications
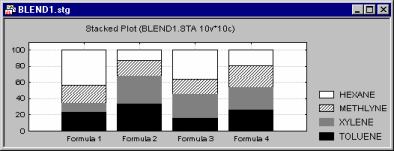
Sequential/Stacked Plots are used to present sequences of values of selected variables. Sequential/stacked line plots can be used for some of the applications reviewed in line plots. However, the stacked feature of those graphs (applicable when more than one variable is selected) is specifically designed to represent the broad category of data sets in which consecutive variables represent parts ("portions") of one whole. For example, each case may represent a particular formulation of a chemical blend, and each of several variables may represent the volume of one of several chemicals in each formulation. If such data were represented as a stacked column graph, then the total height of each column would indicate the total volume of the blend, and each of its stacked segments would show the relative contribution of the respective chemicals.

If the variables shown in the graph represent percentages and/or add up to the same value (e.g., 100%) for each "case," then the total height of the graph will be constant across cases.