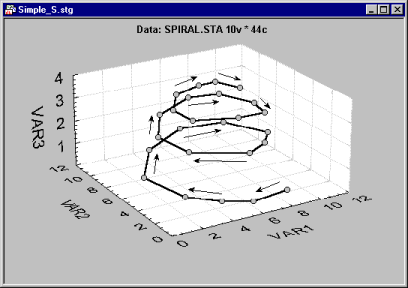
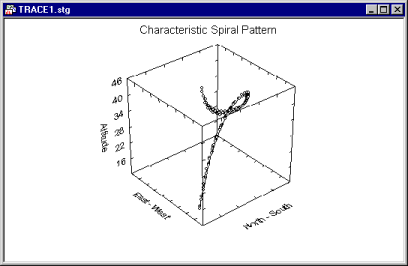
As in 3D Scatterplots, each data point in a trace plot is represented by its location in 3D space as determined by the values of the variables selected as X, Y, and Z (and interpreted as the X, Y, and Z axis coordinates). The data points are then connected sequentially (in the order encountered in the datafile) with a line to form a "trace" of a sequential process (e.g., movement, change of a phenomenon over time, etc.).

A good metaphor of the information that is best represented in a trace plot is that of the trajectory of an object in three-dimensional space.

In general, any sequential process (or processes) that simultaneously produces changes in three dimensions over consecutive measurements can be studied via the trace plot.
Multiple trace plot. The multiple trace plot differs from the regular trace plot only in that it allows for a list of Z variables; thus, multiple "trajectories" can be simultaneously displayed.

Applications
Examples of datasets that match the trajectory metaphor above could be the behavior of any multivariate time series. Suppose you measured the temperature, pollution level, and ozone content of the air in a large city over consecutive months for several years. Since those variables are likely cyclical in nature (i.e., it is cold in the winter in the northern hemisphere), a characteristic pattern would emerge; moreover, the pattern is usually not simple (e.g., linear) in nature. The prices for several commodities or multiple economic indicators could also be studied via this graph; that is, characteristic patterns or "trajectories" over time may become apparent.
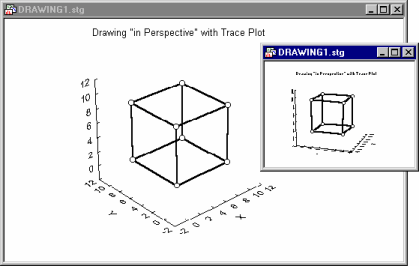
3D drawings. Another application of this graph is to generate precise "3D drawings" (by providing coordinates in 3D space) of objects such as control limits, marked areas, etc. Typically, in order to customize (by overlaying) 3D data plots, 3D objects "drawn" by the trace plot facility become active parts of the 3D display, and thus they can be rotated and transformed in perspective (see below). Note that such objects cannot be drawn interactively since there is no method to control the third dimension (i.e., the "depth") in drawn objects (they can only be "drawn" by specifying 3D coordinate systems in STATISTICA Visual Basic).

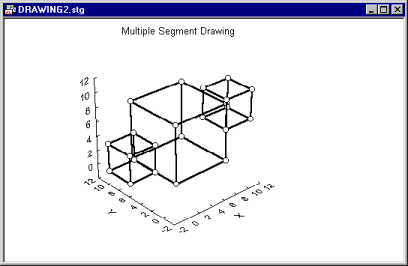
Inserting an incomplete case (i.e., a case with either one or two, but not all three values X, Y, and Z) into the dataset presented as a trace plot will break the line.

This feature can be used to create separate objects (as shown above).