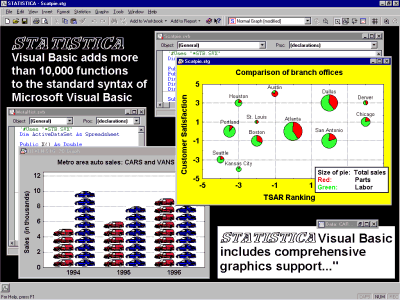
STATISTICA graphical options can also be accessed programmatically using the built-in STATISTICA Visual Basic or other compatible languages. Therefore, there are no limits to how "deeply customized" your STATISTICA custom graphs can be, because STATISTICA Visual Basic (with all its powerful custom drawing tools as well as the STATISTICA-based library of graphics procedures) can be used to produce virtually any graphics or multimedia output supported by the contemporary computer hardware. These custom developed displays or multimedia output can be assigned to STATISTICA toolbars, menus, or dialogs and become a permanent part of "your" STATISTICA application.
An application written in STATISTICA Visual Basic can operate on graphs in three ways:
Every graph available in STATISTICA can be produced by STATISTICA Visual Basic and then customized using STATISTICA procedures or general options offered in this comprehensive language.

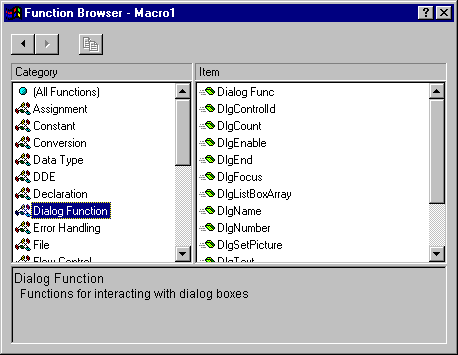
As with all other functions of STATISTICA Visual Basic, functions to access the graphics library of STATISTICA can be easily incorporated into STATISTICA Visual Basic programs via a hierarchically organized Function Browser, which contains short descriptions of all functions and options to insert them directly into the source code of your program (i.e., into the STATISTICA Visual Basic Editor).

For more information on accessing the graphics libraries of STATISTICA via the STATISTICA Visual Basic programming language, see STATISTICA Visual Basic Index.