When you select this method, STATISTICA will create one category (or graph in the case of categorized graphs) for each unique value. The unique values can be either floating point or integral, and STATISTICA can handle up to 1,000 unique values.
The following options dictate how the categories are organized in the graph:
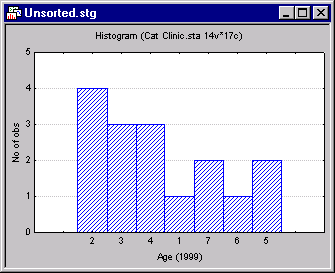
Unsorted. Select Unsorted to plot the categories in the same sequence as they occur in the data set.

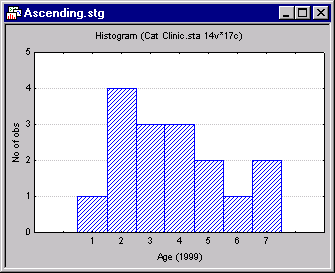
Asc. Select Asc to plot the categories in ascending order.

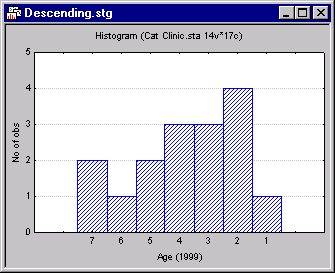
Desc. Select Desc to plot the categories in descending
order.
