Lest we wax overconfident, let's take a quick look at how life might change if the protocol were differentTCP/IP, for example. (Recall that we must have SNMP installed to see the TCP/IP counters in Performance Monitor.) If there are multiple protocols installed, the client must have TCP/IP as the highest priority protocol, or it must be the only one available on the server. The highest-priority protocol is the first protocol the workstation uses when it attempts to make a connection.
The protocols currently being used on the workstation are listed in the large box. The one on top has the highest priority.
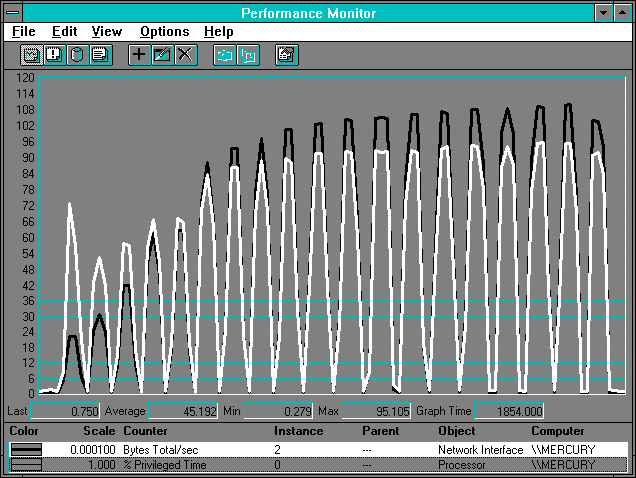
In Figure 7.31, we show the throughput chart for TCP/IP from the client's perspective. Again we are bypassing the cache on the client side and are reading 512-, 1024-, 2048-, and 4096-byte amounts, and then page size increments of record sizes up to 16 pages. We've changed the Vertical Maximum to view all the chart values.
Figure 7.31 Throughput chart for TCP/IP
We get similar throughput with TCP/IP as we did with NetBEUI in Figure 7.1. At higher record sizes the TCP/IP throughput is actually a bit higher than what can be achieved with NetBEUI.
The TCP/IP counters in Performance Monitor implement Management Information Base II (MIB-II) for use with protocols in TCP/IP-based internets. So we can get some idea of what is happening here, let's look more closely at the 2048-byte read (like we did for NetBEUI). First we look at the Network Interface level. This is the closest to the media that we get with the TCP/IP counters.
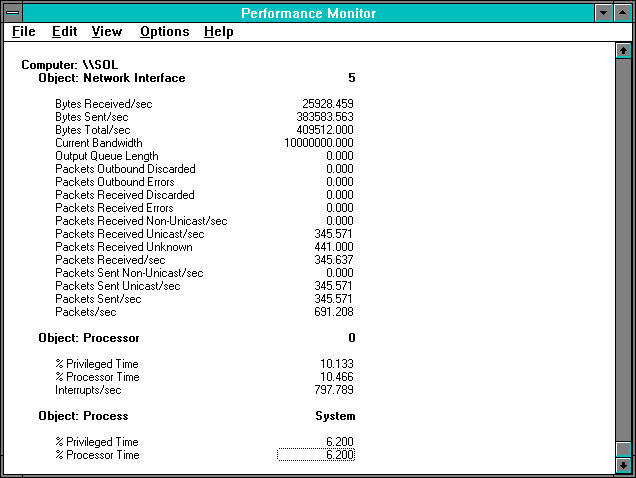
Figure 7.32 Network Interface of TCP/IP doing 2048-byte reads, server side
Dividing both Bytes Received/sec by Packets Received/sec and Bytes Sent/sec by Packets Sent/sec, we find that the packets are 75 bytes each on the receiving side and 1110 bytes on the send side. The value of Bytes Total/sec is slightly below the comparable value for NetBEUI. The Current Bandwidth is a constant for Ethernet measured in bits per second. The term "Unicast" means the packets were addressed to this particular computer (as opposed to "broadcast to all on the subnet" or "multicast to several on the subnet"). The other packet categories refer to undelivered packets. Protocols sometimes discard packets even if there are no errors; for example, to free up buffer space. Errors indicate the packet contained problems that prevented the delivery to a higher level protocol (meaning IP). The Output Queue Length refers to the current number of packets pending output and is an instantaneous counter.
As you can see from Figure 7.31, processor usage for TCP/IP is higher than it is for NetBEUI, as we would expect for this more complex, layered, routing protocol. Interrupt rate is almost identical to the NetBEUI case.
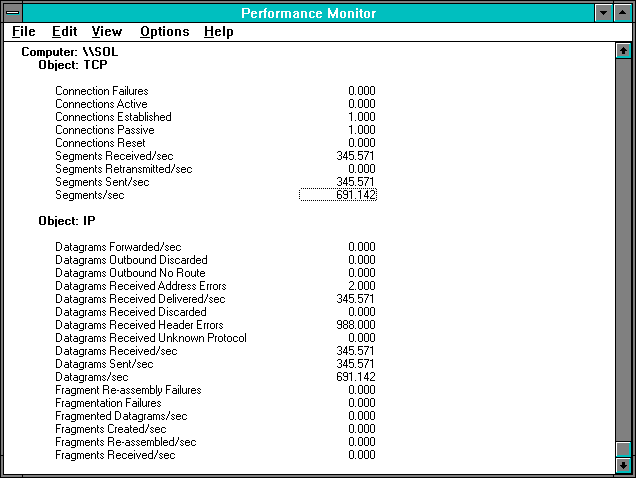
Figure 7.33 Server TCP/IP counters during 2048-byte reads
The next layer above the Network Interface is the IP (Internet Protocol) layer. This layer sees only datagrams. Higher-level protocols (TCP in this case) supply the end-to-end integrity to assure there are no out of sequence or missing packets. At this level, a variety of different dispositions of datagrams are counted. If there are data integrity problems you can often detect them here.
Datagrams Forwarded/sec is the rate at which this node is acting as an IP gateway, forwarding packets received by, but not addressed to, this node. This includes any for which No Route could be found and so were discarded (DataGrams Outbound No Route.) The IP layer can reassemble long transmissions sent as fragments, and a number of counters are devoted to tracking this activity. Reassembly can fail due to errors or time-outs.
The Transmission Control Protocol (TCP) supplies end-to-end connections using IP and assures all packets are delivered. If they are not, retransmission is invoked. This object provides a simple high-level view of the number of packets sent and received.
The User Datagram Protocol (UDP) provides a direct, rapid interface to IP without the need to first establish a connection with the recipient. However, the delivery of packets can be out of sequence or duplicated, or packets can be dropped. Usually a given application will use either TCP or UDP to communicate with IP. So these counters were all zero in this test case.
The Internet Control Message Protocol (ICMP) is an ancillary protocol layer attached just above IP. It handles a number of special internet message tasks:
These counters are also all 0 in this case, so they are not shown.
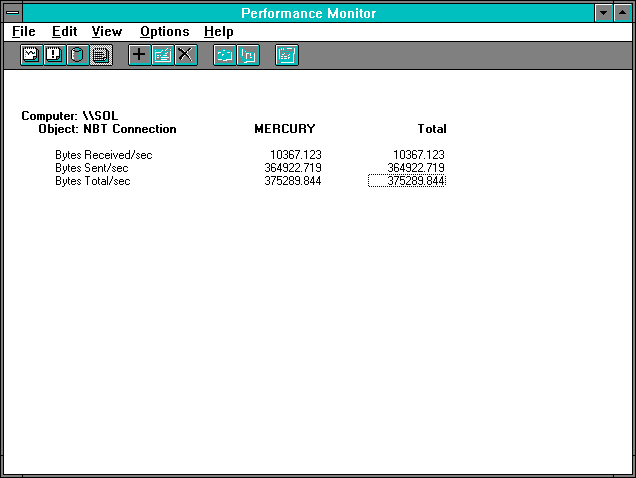
Figure 7.34 Server NBT statistics during 2048-byte reads
The NetBEUI TCP/IP Connection (NBT Connection) object individually records transmissions to all connection points and is an extremely useful item on congested servers. NBT Connection resides on top of the TCP layer in the protocol stack. NBT counts inbound and outbound byte rates, and has an instance for each open connection and a total for all connections. You can use it to determine which of several connections is sourcing a load, and in which direction. It's handy, handy, handy. We wish every protocol had it.
We generated a little UDP traffic so that it wouldn't be left out. UDP always gets a bum rap because its known in Internet circles as being unreliable. Imagine, value judgments on protocols. Anyway, the next few figures show some UDP action from the server's perspective. We are sending 1024-byte writes from a process on the client to a process on the server using Windows Sockets (WinSock) to connect to UDP. In this case WinSock provides the end-to-end packet integrity and so can use the "unreliable" UDP. This does not invoke the server process on the server at all, but acts more like an application such as SQL server might.
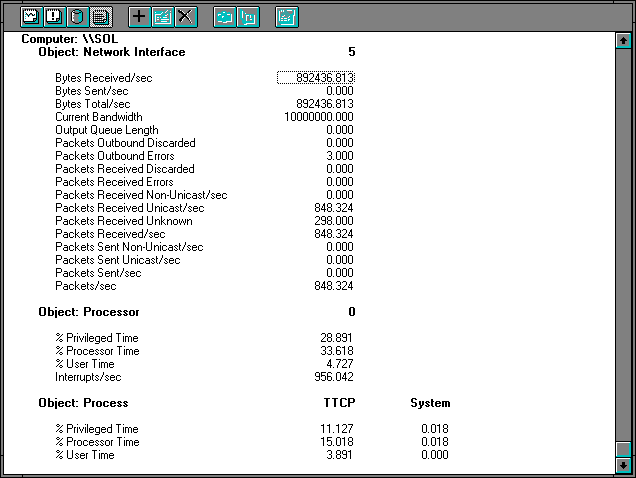
Figure 7.35 Server's Network Interface statistics during 1024-byte writes to the server
Now that's one cookin' protocol. That is as fast as we have seen bytes fly for this record size. And that's as high an interrupt rate as we have seen, too. It has resulted in a correspondingly high processor usage. All just as pretty as can be!
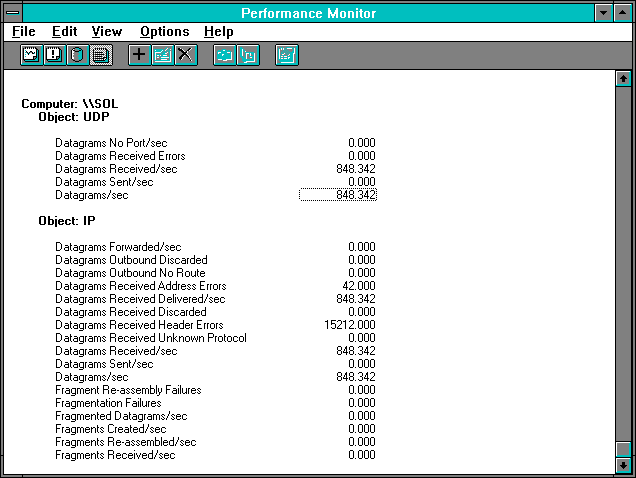
Figure 7.36 Server's UDP/IP statistics during 1024-byte writes to server
After all that blazing speed, the UDP counters are a little anti-climactic. Don't worry about those 42 IP: Datagrams Received Address Errors. They all occurred during the setup of the test. Since this is an instantaneous count of the current total number of such errors, we just have to chart it during the test. If it does not change while we are testing, then all the errors occurred before the test. We checked, and they did.
Anyway, there's a brief rundown of the TCP/IP counter set. You can get all the basic throughput information you need to determine your throughput ceilings. And you get that wonderful NBT Connection object thrown in, not to mention some pretty special performance from the WinSock/UDP/IP protocol stack.