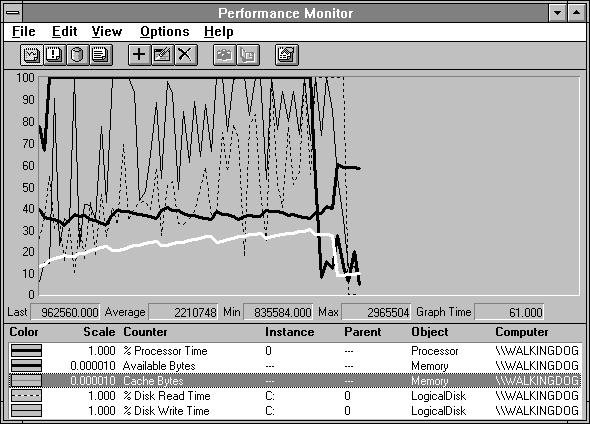
Let's take a look at another very common case. Let's process this file sequentially, first reading a record and then writing it. We'll set the record size to 512 bytes this time. We still have a 10-MB file. The next figure tells the tale.

Figure 6.6 Cache and disk activity while reading and writing a large file sequentially
Processor utilization is the heavy black line at the top of the chart: it's pinned at 100%. The disk is quite busy both reading (dotted line) and writing (thin black line). The cache does not grow as large even though we are processing the entire 10 MB file, much more data than in the last example. Why? The cache manager detects that the file is being read sequentially and realizes that retaining lots of file data in the cache will not help much, because it is probably not being re-referenced. The next figure shows the cache statistics for this case.
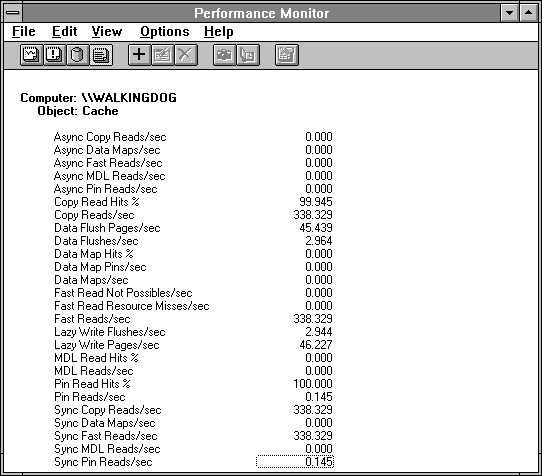
Figure 6.7 Cache statistics for read/writing a large file sequentially
The high Copy Reads/sec of the example in the previous section are lower here because now we are writing the data as well as reading it. There are 45 Data Flush Pages/sec, but the flush is only occurring 2.9 times per second. This means we are sending out 45/2.9 or about 15 pages on each flush. This also tells us that the cache manager has discovered the sequential nature of our file access and is grouping together lots of pages to expel at once. As we have seen previously, large transfer blocks are very efficient. The lazy writer would like to write the sequential data in 64K chunks. However, the lazy writer is not doing all the writing here because there are just a few more Data Flushes/sec than Lazy Write Flushes/sec. This means the mapped page writer has become concerned about memory from time to time and does a little page output of its own. This can interfere with the sequential nature of the lazy write output and slightly reduce the number of pages per write.
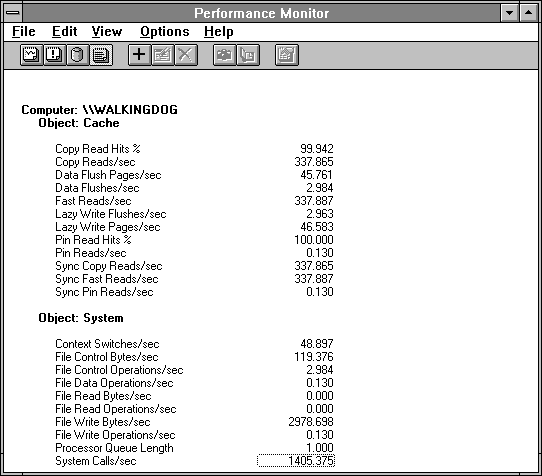
Figure 6.8 Cache and system statistics for read/writing a large file sequentially
We can tell for sure from Figure 6.8 that we are on the fast read path because the file operation counts in the System object are nearly all zero. This means the I/O manager is diverting requests to the cache and it rarely needs to get the file system involved in data retrieval or deposit. We see 1405 system calls for every 338 reads, for four system calls per read. We happen to know that there is a write for every read because that is what we told the probe to do, and we'll get a seek for every read because that's what the general algorithm in the probe does.
The system needs to perform a seek for the write to get back to the start of the latest read so we can rewrite the record. It's not hard to see why there are four system calls per read. The WAP tool we discuss later in Chapter 10 would be a more direct way to determine application file activity.
Look at how efficient data flushing is. Although we are doing almost 338 reads per second and the same number of writes, the lazy writer is only waking up about 3 times per second and writing 15 pages each time. The System process is only using 3.3% of the time to do all this. The following figure shows the threads of the System process. That process is using very little processor time to eject these pages. The threads most involved here are the lazy writer thread, the mapped page writer thread, and the modified page writer thread (clearing memory for the cache). If the system is creating a file, the demand zero thread works to create page frames filled with zeros. If memory is tight, the working set manager thread works to trim working sets to make space.
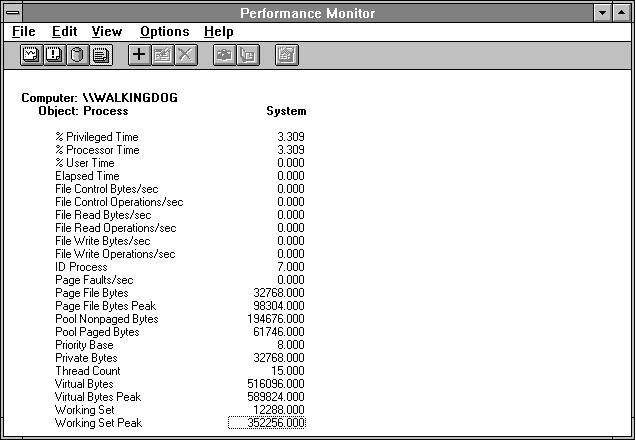
Figure 6.9 Lazy writing by the System process is truly lazy
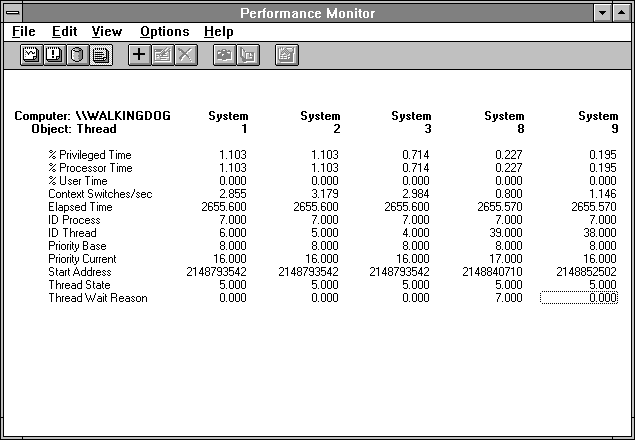
Figure 6.10 System process threads divide the lazy work up
Let's see how the disk fares under all this pressure. Figure 6.11 shows disk behavior and how that behavior relates to cache and virtual memory activity. Let's continue to look at the output side. If we add Cache: Data Flush Pages/sec and Memory: Pages Output/sec we get 50.605 per second. Multiplying by 4096 bytes/page gives 207208 bytes per second, quite close to the 210955 Write Bytes/sec the disk drive is seeing. The reason the lazy writer thinks more pages are written is that after they have been handed to the data flusher, they are handed to the memory manager. It's the memory manager that makes the ultimate decision about whether the page is still dirty or not. So some lazy write flushed pages may already have been written by the memory manager by the time the data flusher tries to write them.
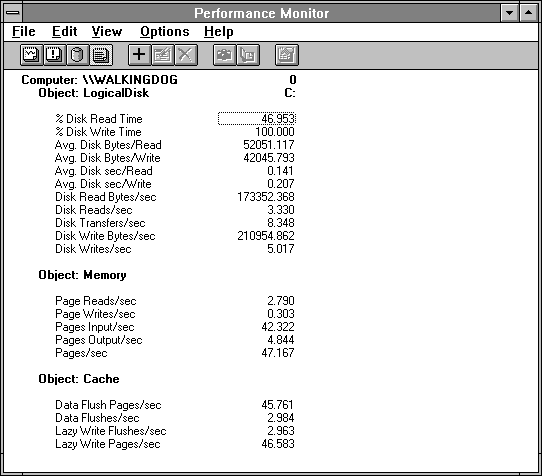
Figure 6.11 Disk response to cache activity during sequential read/writing
On the read side of the fence, we see the Memory: Pages Input/sec = 42.322, which, multiplied by the page size, gives 173392 bytes input per second. This is so close to the 173352 Disk Read Bytes/sec that we are in ecstasy (recall the 9th Rule of Bottleneck Detection).
Looking at Avg. Disk Bytes/Read and Avg. Disk Bytes/Write we see fairly high numbers, which is good. But because the lazy writer is trying to write 64K chunks on sequential output, it's a shame the Avg. Disk Bytes/Write are not that high. What's going on here? The next figure really ties a bow around this issue.
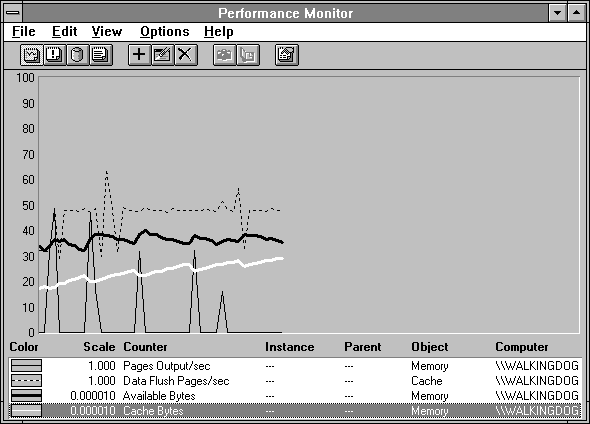
Figure 6.12 Memory manager and cache manager make sweet music together
The memory manager's work is shown as Memory: Pages Output/sec in the thin black line. Notice how it has five spikes. Let's consider them one at a time, moving from left to right. The first spike emits 48 pages (in three writes but we can't show everything on one chart), adds to Available Bytes, and takes little from the cache. The cache manager is trying to write 48 pages each second (also in three data flushes, as we have seen) but right after the memory manager writes its 48 pages, the cache manager backs off to 30 pages for a second. In the next spike, the memory manager writes some more data, this time having taken some pages from the cache (white line). But we know it took pages from other working sets as well because the increase in Available Bytes is greater than the decrease in Cache Bytes. In reaction the cache manager again writes fewer than the normal 48 pages as a net result of the next three seconds of activity.
In the third output, the memory manager backs off to writing out only 32 pages. This time the cache supplied most of the Available Bytes. In the fourth spike of 32 pages, nearly all of the memory taken comes from the cache. The memory manager sees that it is not making headway, but gives it one last try, extracting 16 pages from the cache, and a few seconds later the cache manager again writes fewer pages to the disk in its flush.