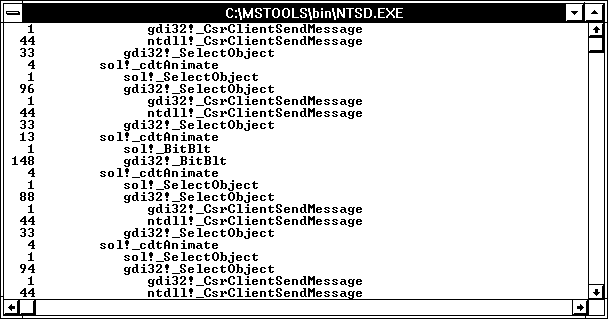
Finally, we'd like to point out that there is a special cool performance feature in the Windows NT symbolic debugger. The wt command can be used to trace calls in a program and the number of instructions between them. Just type wt and watch those instructions fly!

Figure 10.22 Windbg wt command of a portion of the Solitaire cascade
This is a tool that lets you get right down to the details of what is happening in your code without the burden of tracing every instruction. In a way it gives you the same information as CAP, though far less quickly. But it avoids the recompile that CAP requires, and sometimes you just want to take a quick look at a small issue. That's when wt is a diamond in the rough. It can help to have those same system DLLs with debugging symbols that CAP uses. Go get them and have at it.