It is much quicker to read records in sequence than to read them from different parts of the disk, and it is slowest to read randomly throughout the disk. The difference is in the number of required seeks, operations to find the data and position the disk head on it. Moving the disk head, a mechanical device, takes more time than any other part of the I/O process. The rest of the process consists of moving data electronically across circuits. However slow, it is thousands of times faster than moving the head.
The operating system, disk driver, adapter and controller technology all aim to reduce seek operations. More intelligent systems batch and sequence their I/O requests in the order that they appear on the disk. Still, the more times the head is repositioned, the slower the disk reads.
Tip
Even when an application is reading records in the order in which they appear in the file, if the file is fragmented throughout the disk or disks, the I/O will not be sequential. If the disk-transfer rate on a sequential or mostly sequential read operation deteriorates over time, run a defragmentation utility on the disk and test again.
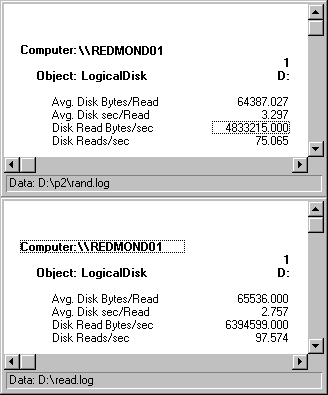
The following figure compares random to sequential reading to show how random reading affects disk performance. In the top report, the disk is reading 64K records randomly throughout a 40 MB file. Performance Monitor is writing its log to a different physical drive. In the bottom report, the same disk is reading 64K records in sequence from a 60 MB file, with Performance Monitor logging to a different logical partition on the same drive.

The difference is quite dramatic. The same disk configuration, reading the same size records, is 32% more efficient when the records read are sequential rather than random. The number of bytes transferred fell from 6.39 MB/sec to 4.83 MB/sec because the disk could only sustain 75 reads/sec, compared to 97.6 reads/sec for sequential records. Queue time, as measured by Avg. Disk sec/Read, was also 1/3 higher in the random reading test.
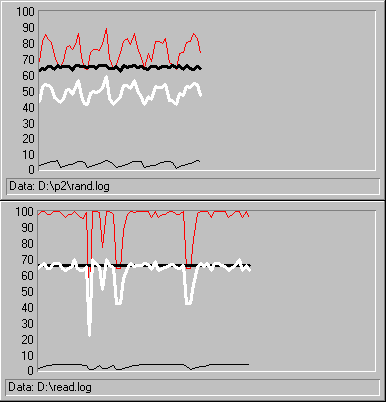
The following figure shows the graphs of the two tests so you can see the differences in the shape of the curves. The top graph represents random reading; the bottom represents sequential reading.

In both graphs, the top line is Disk Reads/sec, the thick, black line is Avg. Disk Bytes/Read, the white line is Disk Read Bytes/sec, and the thin, black line near the bottom is Avg. Disk sec/Read. The time window was adjusted on both graphs to eliminate startup and shutdown values, and the counter values were scaled to get them on the chart. The counter scales are the same on both charts.
Also, Disk Reads/sec and Disk Read Bytes/sec are scaled so that their lines meet when the disk is reading an average of 100 bytes/sec, the norm for this disk configuration reading sequential records of a constant size. Space between the lines indicates that the disk is reading more or less than 100 bytes/sec. This is where the 1/3 efficiency gain in sequential reads is most pronounced.
The sequential test graph is less regular because the log is being written to the same drive. Nonetheless, the transfer rate curve is straighter on the sequential test, showing that the disk is spending more time reading. The attractive pattern on the random graph appears because the disk assembly must stop reading and seek between each read. Had it been able to measure at a much higher resolution, it would show the transfer rate dropping to zero and then spiking back to 100 reads/sec.
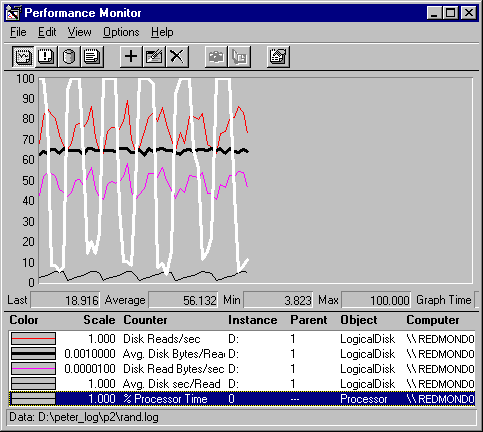
To examine the cause of the pattern in the random test, add Processor: %Processor Time to the graph. If you have a multiprocessor computer, substitute System: %Total Processor Time.

In this example, the Processor: % Processor Time is the white line superimposed upon the previous graph of the random test. The processor time follows the same pattern as the transfer rate, but is offset by about half of the read time. The processor, which is not particularly busy otherwise, is consumed for short periods while it locates the drive sector for the read operation. Once the sector is found, the read can begin, and the processor can resume its other threads until the read is complete, when it is again interrupted by the next seek request.
Although it is often impractical to read records sequentially in a real application, these tests demonstrate how much more efficient the same disk can be when reading sequentially. The following methods can improve disk efficiency:
If your disk is used to read data from many different files in different locations, it cannot be as efficient as it might otherwise be. Adjust the expected values for the disk based upon the work it is expected to do.