The file system cache is a part of memory. It can be thought of as the working set of the file system. When memory becomes scarce and working sets are trimmed, the cache is trimmed as well. If the cache grows too small, cache-sensitive processes will be slowed by disk operations.
To monitor cache size, use the following counters:
Tip
You can test the effect of a memory and cache shortage on your workstation without changing the physical memory in your computer. Use the MAXMEM parameter in the boot configuration to limit the amount of physical memory available to Windows NT. For more information, see "Configuring Available Memory" in Chapter 12, "Detecting Memory Bottlenecks."
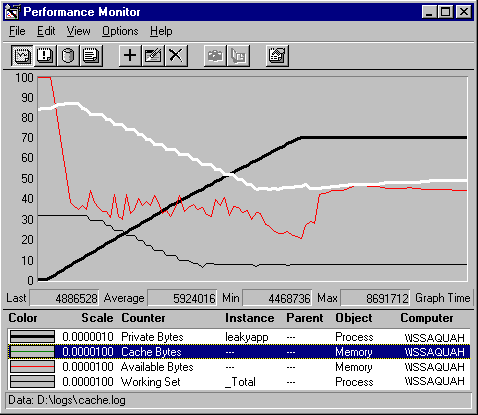
The following graph shows that a memory shortage causes the cache to be trimmed, along with the working sets of processes, and other objects that compete with the cache for space in memory. The memory shortage was produced by running LeakyApp, a test tool that consumes memory.

In this graph, the thick black line represents Process: Private Bytes for LeakyApp. (Note that it has been scaled to 0.000001 to fit on the graph.) At the plateau in this curve, it held 70.4 MB of memory. The white line represents Memory: Cache Bytes. The gray line is Memory: Available Bytes, and the thin black line is Process: Working Set.
In this example, run on a workstation with 32 MB of physical memory, the memory consumption by LeakyApp affects all memory, but not to the same degree. Available Bytes drops sharply then recovers somewhat, apparently because pages were trimmed from the working sets of processes. Cache size falls steadily until all available bytes are consumed, and then it levels off. In addition, page faultsnot shown on this already busy graphincrease steadily as working sets and cache are squeezed.
The effect of a smaller cache on applications and file operations depends upon how often and how effectively applications use the cache.