The memory counters, Page Reads/sec and Pages Input/sec, are indirect indicators of disk activity due to paging. Use the counters on the Logical Disk object to show paging from the perspective of the disks.
Note
To enable the physical or logical disks counters, you must first run the Diskperf utility. At the command prompt, type diskperf -y, then restart the computer. For fault tolerant disk configurations (FTDISK), type diskperf -ye, then restart the computer. For more information, see "Enabling the Disk Counters" in Chapter 14, "Detecting Disk Bottlenecks."
To investigate the effect of paging on your disks, add the following counters for the Logical Disk object to your memory charts and reports:
The disk activity counters, % Disk Read Time and Avg. Disk Read Queue Length, indicate disk reading activity during periods of high paging, as measured by the memory counters. Because disk activity has many causes, the Disk Reads/sec counter is included. This lets you subtract the reads due to paging (Memory: Page Reads/sec), from all reads (Disk Reads/sec), to determine the proportion of read operations caused by paging.
The transfer rate (as represented by Avg. Disk Bytes/Read) multiplied by Disk Reads/sec yields the number of bytes read per second, another measure of disk activity.

Please do not delete this hidden text. It enables me to recreate the graph. Log: Mem2.log, Time window= 2:00:30:9 - 2:03:40:2, Pbrush: 3_7.bmp
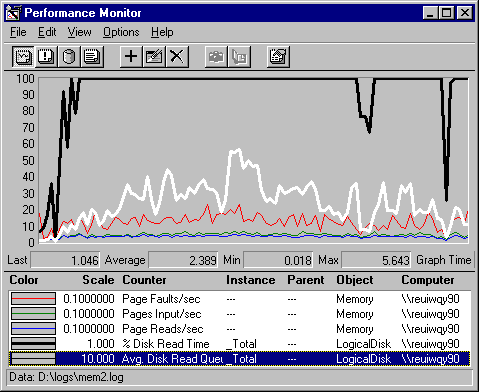
In this graph, the thick black line running at 100% for most of the test interval is % Disk Read Time: _Total JBJBAs the following report shows, total disk read time for both disks actually exceeds 100%.
The white line, Avg. Disk Read Queue Length, shows that the high disk activity is producing a large queue to disk. The scale is multiplied by 10 so that you can see the line. The disk queue averages more than 2 and, at its maximum, exceeds 5. More than two items in the queue can affect performance.
The remaining lines, representing the memory counters, are scaled quite small so that they can fit in the graph. Their values are more evident in the following report.

Please do not delete this hidden text. It enables me to recreate the graph. Log: Mem2.log, Time window= 2:00:30:9 - 2:03:40:2, Pbrush: 3_8.bmp
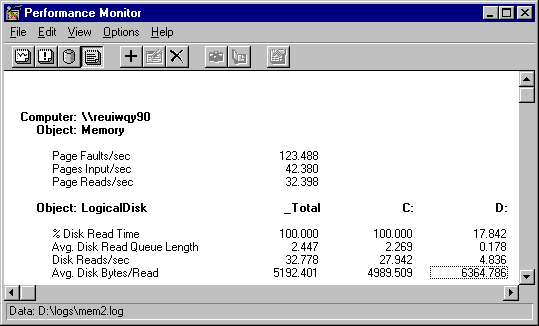
Although this report displays the same information as the graph, it shows average values for all counters. In this example, the average rate of page faults123 per secondis extremely high. But the Pages Input/sec counter shows that, on average, only 42 of them, or 34%, were retrieved from disk. The rest of the pages are found in memory.
The 42 pages retrieved per second on average required 32 reads from the disk per second from the disk. Even though two-thirds of the page faults were satisfied by memory, the remaining one-third was enough to consume the disk and produce a large queue. In general, a high-performance disk is capable of 40 I/Os per second. This disk was quite close to its physical maximum.
Logical Disk: Disk Reads/sec: _Total, a measure of all disk reads, at 32.778 per second, is within sampling error range of the 32.398 average Memory: Page Reads/sec. This shows that virtually all of the reading was done to find faulted pages. This confirms that paging is cause of the bottleneck. If this pattern were to persist over time, it would indicate a memory shortage, not a disk problem.