Reading and writing randomly throughout a disk is about the most laborious process required of disks. The constant seek activity consumes the disk and the processor. These issues were discussed in detail in the earlier section, "Random vs. Sequential Reading." This section describes how to test the effect of random reading on your volume set.
Note
As in the previous section, the relative values for reads and writes are nearly indistinguishable, so data for writing is not shown here. You can, however, use the same methods to explore random writing performance on your disks.
As before, these reading tests were run on a stripe set of four physical disks. Disks 0, 1, and 2 are on a single disk adapter, and Disk 3 is on a separate adapter. Also, Performance Monitor is logging to Disk 3. In each test, the test tool is doing random, unbuffered reads of 64K records from a 60 MB file. The test begins reading only from Disk 0, and adds a disk with each iteration of the test to end with four stripes.
During the test, Performance Monitor was logging to Stripe_rand.log. This log is included on the Windows NT Resource Kit 4.0 CD, so you can follow along and chart additional counters.
Stripes sets are know for their seeking efficiency. They are created by associating free space in multiple physical disks. Code and data written to the stripe set is distributed evenly across all disks. Because each disk in the set has its own head stack assembly, the heads on each disk in the set can seek simultaneously. Some performance loss is expected when the disk is reading randomly, but it should not be as pronounced as on single disks or on unassociated disk configurations.
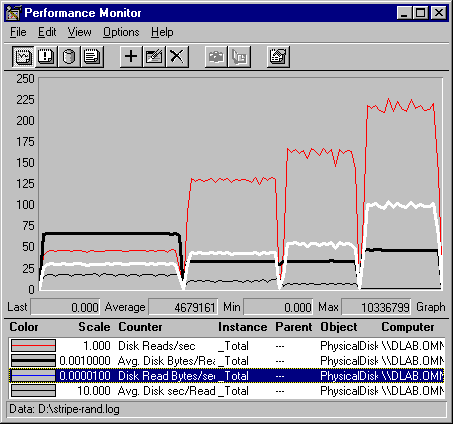
This following graph shows an overview of random reading performance for the disk set.

In this graph, the gray line is Disk Reads/Sec: Total, the thick, black line is Avg. Disk Bytes/Read: Total, the white line is Disk Read Bytes/Sec: Total and the thin, black line is Avg. Disk sec/Read: Total. The vertical maximum as been increased to 250 to incorporate all values.
The trend is much like that for sequential reads. As more stripes are added, the transfer rate (Disk Reads/sec) and throughput (Disk Read Bytes/sec) increase, and the queue (Avg. Disk sec/Read) diminishes.
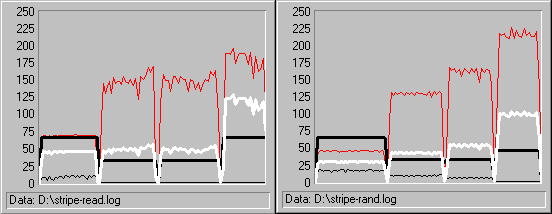
The following figure compares the performance graphs of random and sequential reading by stripe sets. The graph on the left is sequential reading; the graph on the right is random reading. Both graphs in the figure show values for the _Total instance, representing all physical disks in the stripe set.

In both graphs, the gray line is Disk Reads/sec: Total, the thick, black line is Avg. Disk Bytes/Read: Total, the white line is Disk Read Bytes/Sec: Total and the thin, black line is Avg. Disk sec/Read: Total. The vertical maximum on both graphs has been set to 250 to incorporate all values.
This figure shows that although the patterns are similar, the values are slightly different. The transfer rate (Disk Reads/sec: Total) increases to more than 215 reads/sec in the random test. Throughput (Disk Read Bytes/sec: Total — the white line) runs lower on the random graph through almost every stage of the test.
The following tables compare the average values for sequential and random reading on the stripe set. To find these values, open a copy of Performance Monitor for each sample interval on the graph. Then use the time window to limit each one to a single sample interval, and display the disk reading counters in a report. These values were taken from four of such reports.
| Total Disk Read Bytes/sec (in MB) Sequential | Total Disk Read Bytes/sec (in MB) Random |
|
1 | 4.52 | 2.95 | 53.2% |
2 | 4.86 | 4.23 | 15% |
3 | 4.82 | 5.31 | -9% |
4 | 11.75 | 9.91 | 18.5% |
| Total Disk Reads/sec (in MB) Sequential | Total Disk Reads/sec (in MB) Random |
|
1 | 68.948 | 45.024 | 53% |
2 | 148.223 | 128.669 | 15% |
3 | 147.069 | 161.310 | -8.8% |
4 | 179.343 | 215.760 | -17% |
Note that the performance lost by reading randomly diminishes significantly as disks are added. On a single disk, throughput on random is 53% lower than on sequential reading. The difference drops to 15% with two disks and, on four disks, throughput is 17% greater on random reading than on sequential reading.
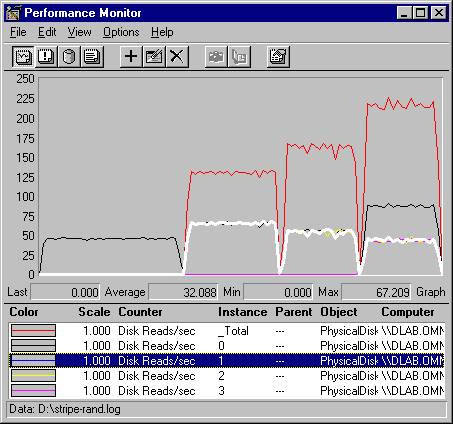
The affect on individual disks in the set follows the patterns evidenced by the sequential reads. The following graph shows the effect of adding disks to the set on the transfer rate of each disk.

Physical Disk: Disk Reads/sec is charted for the _Total instance and for Disks 0 through 3. The gray line is the _Total, the black line is Disk 0, the white line is Disk 1. The lines representing Disks 2 and 3 run along the bottom of the graph until they are added to the test. Then they are superimposed upon the line for Disk 1.
The pattern continues. The transfer rate of the disk set increases with each disk added, but the work is distributed evenly to all disks in the set. The proportion of transfers for each disk declines accordingly.
The average values are shown in the following table.
#Stripes | Disk Reads/sec | |||||
Disk 0 | Disk 1 | Disk 2 | Disk 3 | Total | ||
1 | 45.024 | 0.000 | 0.000 | 0.000 | 45.024 | |
2 | 64.379 | 64.290 | 0.000 | 0.010 | 128.669 | |
3 | 54.449 | 53.289 | 53.572 | 0.000 | 161.310 | |
4 | 86.646 | 43.504 | 42.905 | 42.705 | 215.760 | |
As observed in the sequential reads, the increased workload is distributed equally among all disks. There appears to be slightly more variation in the values, but it is too small to measure accurately without a much larger sample pool. Again, the transfer rate on Disk 0 increases significantly when the fourth disk is added. It is probably doing its share of the reading and also updating the FAT table.
The following graph shows the throughput values for random reading on a stripe set. The chart shows Disk Read Bytes/sec for all disks in the stripe set.

In this graph, the gray line is the _Total instance for all disks, which increases as more disks are added to the stripe set. The heavy, black line is Disk 0, and the white line is Disk 1. The lines representing Disks 2 and 3 run along the bottom of the graph until they are added to the test. Then, they are superimposed upon the line for Disk 1.
This table shows the average values.
#Stripes | Disk Read Bytes/sec (in MB) | |||||
Disk 0 | Disk 1 | Disk 2 | Disk 3 | Total | ||
1 | 2.95 | 0.00 | 0.00 | 0.00 | 2.95 | |
2 | 2.09 | 2.15 | 0.00 | 0.00 | 4.23 | |
3 | 1.79 | 1.76 | 1.76 | 0.00 | 5.31 | |
4 | 5.68 | 1.45 | 1.45 | 1.4 | 9.91 | |
As disks are added, total throughput for the disk set increases 3.36 times, from 2.95 MB/sec to 9.91 MB/sec, compared to a 2.6 times increase for sequential reading. FTDISK is clearly taking advantage of the stripe set.
It is clear from this data that stripe sets are a very efficient means of disk transfer, and that the difference is especially apparent on very seek-intensive tasks such as random reading.
Although it is not shown in these graphs, processor use remained at 100% for the duration of the sequential and random reading and writing tests on stripe sets. The improved productivity has a cost in processor time.