Single-Process Bottlenecks
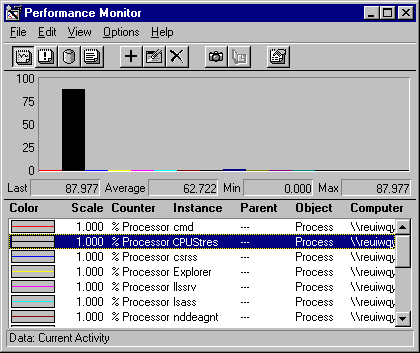
The following figure, captured during a processor bottleneck, is a histogram of a processor bottleneck caused by a single process. This example was produced by running CPU Stress, a tool on the Windows NT Resource Kit 4.0 CD.

This histogram shows that a single process (represented by the tall, black bar) is highly active during a bottleneck; its threads are running for more than 80% of the sample interval. If this pattern persists and a long queue develops, it is reasonable to suspect that the application running in the process is causing the bottleneck.
Note that a highly active process is a problem only if a queue is developing because other processes are ready to run, but are shut out by the active process.
Note
Histograms are useful for simplifying graphs with multiple counters. However, they display only instantaneous values, so they are recommended only when you are charting current activity and watching the graphs as they change. When you are reviewing data logged over time, line graphs are much more informative.
If you suspect that an application is causing a processor bottleneck:
- Stop using the application for a few days or move it to a different computer. Then, log processor use again. If the problem disappears, it is likely to have been caused by the application. If processor use continues to be a bottleneck even without the application, repeat the procedure, carefully monitoring the processes that are active when queues are longest.
- If you have traced the bottleneck to a single application, you might consider replacing it. If it is your application, you can examine its threads in detail or change its base priority. These options are described in the next sections.
- You can also use Performance Monitor to tune an inefficient application. The Win32 Software Development Kit includes tools and methods for optimizing applications, including instructions for building extensible counters to monitor the inner workings of your application.
- As a temporary solution, you can change the base priority of the active application or of an application that is being prevented from running. You can also change the relative priority of foreground to background applications. These solutions, discussed in detail in "Examining Application Priority" later in this chapter, might help you get your urgent work done while you search for a long-term solution.
- As a last resort, upgrade the processor or add additional processors. Multithreaded applications can run on multiple processors, relieving the load. However, single-threaded applications will not benefit; they must be resolved by replacing the processor with a faster one.

