These architectural changes are manifest in several different ways but are most evident when you monitor the behavior of graphics-intensive applications.
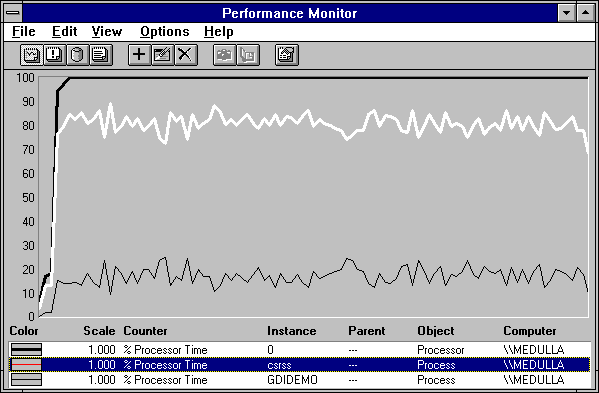
The following figure is a graph of a Windows NT 3.0 running GDIDemo, a graphics demonstration tool in the Win32 Software Development Kit. All features of the tool were used simultaneously to generate the most graphics activity.

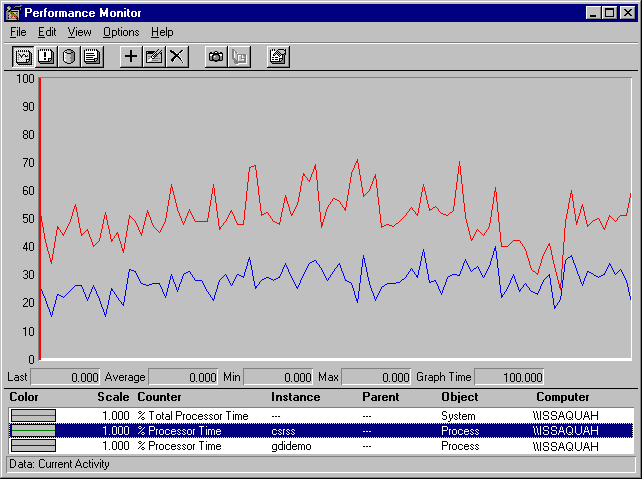
In this example, the processor is 100% busy and is spending most of its time running Csrss.exe. The following figure shows the same program running on Windows NT 4.0.

There are significant differences between the performance evidenced in the graphs.
Processor Time:
Some of this might be attributable to the new architecture, but it probably results from improvement in processor technology. The Windows NT 3.51 graph was captured on a computer with a 386 processor; the Windows NT 4.0 was captured on a computer with a 486 processor.
Process Time:
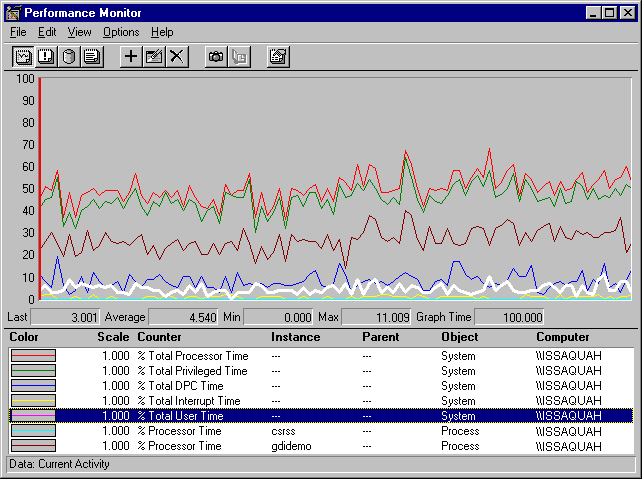
The following graph of the Windows NT 4.0 test is the same as the previous one, but includes counters for privileged and user time and interrupts.

From top to bottom, the lines represent:
This data demonstrates that in Windows NT 4.0, GDIDemo graphics processing time is spent running in privileged mode code in the Windows NT Executive. In previous versions of Windows NT, graphics processing was part of CSRSS and ran mainly in user mode.