Microsoft Office Technical Documentation Group
Created: November, 1995
This article describes the Microsoft Excel chart BIFF file format. The chart BIFF is combined with other sheet BIFF records into the Book stream of a Microsoft Excel workbook file. This article documents only those records unique to charts; these records have record numbers greater than 1000h. Chart BIFF also uses a few records below this range; for information on those records, see Microsoft Excel File Format.
The chart BIFF usually does not contain a complete description of a Microsoft Excel chart but rather a description of how the chart differs from an internal default chart (the simple column chart). Therefore, many of the records in the chart BIFF modify the default chart description. The internal default chart is not the same as the default chart that you set in the Options dialog box.
Although the information contained in BIFF records varies, every record has the same basic format. For more information about the BIFF record format, see BIFF Record Information.
The chart BIFF contains a hierarchical series of records that defines the chart format. Much of the chart data is defined as objects; an object starts with a BEGIN record and ends with a matching END record. For example, a series object definition starts with a SERIES record immediately followed by a BEGIN record. All subsequent records up to the matching END record apply to the specified series.
Objects can be nested within objects; nested BEGIN and END records are used as required to describe objects that are part of other objects. The outer object is called the "parent;" the nested object is called a "child."
The BIFF structure is flexible; it varies depending on the chart type and the elements included in the chart. You can examine the record structure of an existing BIFF file with the BiffView utility.
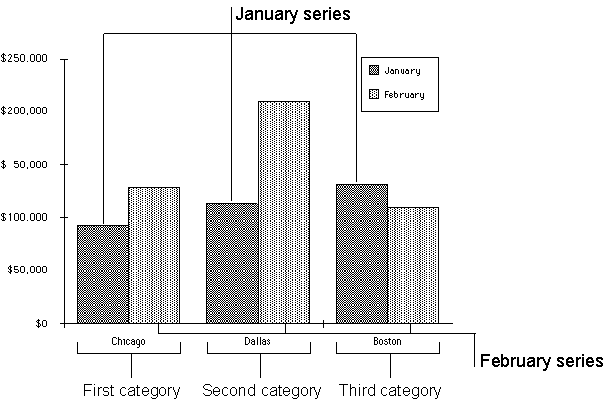
All charts, whether in column, bar, line, pie, area, or scatter format, contain series data, category data, and value data. The following column chart explains the difference between series and categories.
When Microsoft Excel creates a chart from a worksheet, it assigns either the worksheet rows as the series data (and the columns as the category data), or the worksheet columns as the series data (and the rows as categories). If there are fewer rows than columns, then the rows become the series. However, if there are fewer columns than rows, then the columns become the series. If there are an equal number of rows and columns in the range of cells, then the rows become the series.
This algorithm minimizes the number of series on the chart. For example, the following column chart . . .
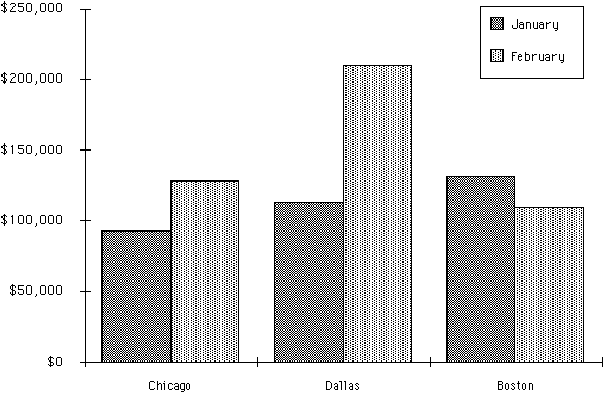
. . . can be created from either of the two following worksheets.
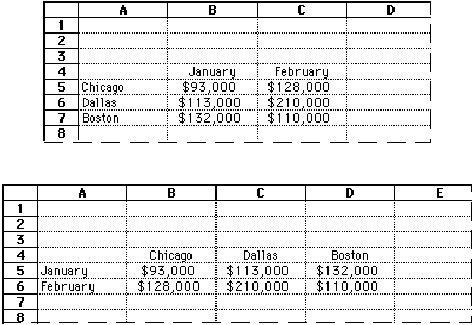
In the second worksheet shown here, January and February are the series (because there are fewer rows than columns), and Chicago, Dallas, and Boston are the categories. In these two worksheets, values for each series appear at three locations on the chart.
If you add sales data for March and April, the series are now Chicago, Dallas, and Boston, and the categories are January, February, March, and April. Microsoft Excel automatically exchanges the series and categories to minimize the number of series.
Chart BIFF Records: Alphabetical Order
|
Number |
Record |
|
103A |
3D: Chart Group Is a 3-D Chart Group |
|
1051 |
AI: Linked Data |
|
1050 |
ALRUNS: Text Formatting |
|
101A |
AREA: Chart Group Is an Area Chart Group |
|
100A |
AREAFORMAT: Colors and Patterns for an Area |
|
100C |
ATTACHEDLABEL: Series Data/Value Labels |
|
1046 |
AXESUSED: Number of Axes Sets |
|
101D |
AXIS: Axis Type |
|
1021 |
AXISLINEFORMAT: Defines a Line That Spans an Axis |
|
1041 |
AXISPARENT: Axis Size and Location |
|
1017 |
BAR: Chart Group is a Bar or Column Chart Group |
|
1033 |
BEGIN: Defines the Beginning of an Object |
|
1020 |
CATSERRANGE: Defines a Category or Series Axis |
|
1002 |
CHART: Location and Overall Chart Dimensions |
|
1014 |
CHARTFORMAT: Parent Record for Chart Group |
|
1022 |
CHARTFORMATLINK: Not Used |
|
101C |
CHARTLINE: Drop/Hi-Lo/Series Lines on a Line Chart |
|
1006 |
DATAFORMAT: Series and Data Point Numbers |
|
1024 |
DEFAULTTEXT: Default Data Label Text Properties |
|
103D |
DROPBAR: Defines Drop Bars |
|
1034 |
END: Defines the End of an Object |
|
1026 |
FONTX: Font Index |
|
1032 |
FRAME: Defines Border Shape Around Displayed Text |
|
104E |
IFMT: Number-Format Index |
|
1015 |
LEGEND: Legend Type and Position |
|
1043 |
LEGENDXN: Legend Exception |
|
1018 |
LINE: Chart Group Is a Line Chart Group |
|
1007 |
LINEFORMAT: Style of a Line or Border |
|
1009 |
MARKERFORMAT: Style of a Line Marker |
|
1027 |
OBJECTLINK: Attaches Text to Chart or to Chart Item |
|
103C |
PICF: Picture Format |
|
1019 |
PIE: Chart Group Is a Pie Chart Group |
|
100B |
PIEFORMAT: Position of the Pie Slice |
|
1035 |
PLOTAREA: Frame Belongs to Plot Area |
|
104F |
POS: Position Information |
|
103E |
RADAR: Chart Group Is a Radar Chart Group |
|
1040 |
RADARAREA: Chart Group Is a Radar Area Chart Group |
|
1048 |
SBASEREF: PivotTable Reference |
|
101B |
SCATTER: Chart Group Is a Scatter Chart Group |
|
105B |
SERAUXERRBAR: Series ErrorBar |
|
104B |
SERAUXTREND: Series Trendline |
|
105D |
SERFMT: Series Format |
|
1003 |
SERIES: Series Definition |
|
1016 |
SERIESLIST: Specifies the Series in an Overlay Chart |
|
100D |
SERIESTEXT: Legend/Category/Value Text |
|
104A |
SERPARENT: Trendline or ErrorBar Series Index |
|
1045 |
SERTOCRT: Series Chart-Group Index |
|
1044 |
SHTPROPS: Sheet Properties |
|
103F |
SURFACE: Chart Group Is a Surface Chart Group |
|
1025 |
TEXT: Defines Display of Text Fields |
|
101E |
TICK: Tick Marks and Labels Format |
|
1001 |
UNITS: Chart Units |
|
101F |
VALUERANGE: Defines Value Axis Scale |
Chart BIFF Records: Record Number Order
|
Number |
Record |
|
1001 |
UNITS: Chart Units |
|
1002 |
CHART: Location and Overall Chart Dimensions |
|
1003 |
SERIES: Series Definition |
|
1006 |
DATAFORMAT: Series and Data Point Numbers |
|
1007 |
LINEFORMAT: Style of a Line or Border |
|
1009 |
MARKERFORMAT: Style of a Line Marker |
|
100A |
AREAFORMAT: Colors and Patterns for an Area |
|
100B |
PIEFORMAT: Position of the Pie Slice |
|
100C |
ATTACHEDLABEL: Series Data/Value Labels |
|
100D |
SERIESTEXT: Legend/Category/Value Text |
|
1014 |
CHARTFORMAT: Parent Record for Chart Group |
|
1015 |
LEGEND: Legend Type and Position |
|
1016 |
SERIESLIST: Specifies the Series in an Overlay Chart |
|
1017 |
BAR: Chart Group is a Bar or Column Chart Group |
|
1018 |
LINE: Chart Group Is a Line Chart Group |
|
1019 |
PIE: Chart Group Is a Pie Chart Group |
|
101A |
AREA: Chart Group Is an Area Chart Group |
|
101B |
SCATTER: Chart Group Is a Scatter Chart Group |
|
101C |
CHARTLINE: Drop/Hi-Lo/Series Lines on a Line Chart |
|
101D |
AXIS: Axis Type |
|
101E |
TICK: Tick Marks and Labels Format |
|
101F |
VALUERANGE: Defines Value Axis Scale |
|
1020 |
CATSERRANGE: Defines a Category or Series Axis |
|
1021 |
AXISLINEFORMAT: Defines a Line That Spans an Axis |
|
1022 |
CHARTFORMATLINK: Not Used |
|
1024 |
DEFAULTTEXT: Default Data Label Text Properties |
|
1025 |
TEXT: Defines Display of Text Fields |
|
1026 |
FONTX: Font Index |
|
1027 |
OBJECTLINK: Attaches Text to Chart or to Chart Item |
|
1032 |
FRAME: Defines Border Shape Around Displayed Text |
|
1033 |
BEGIN: Defines the Beginning of an Object |
|
1034 |
END: Defines the End of an Object |
|
1035 |
PLOTAREA: Frame Belongs to Plot Area |
|
103A |
3D: Chart Group Is a 3-D Chart Group |
|
103C |
PICF: Picture Format |
|
103D |
DROPBAR: Defines Drop Bars |
|
103E |
RADAR: Chart Group Is a Radar Chart Group |
|
103F |
SURFACE: Chart Group Is a Surface Chart Group |
|
1040 |
RADARAREA: Chart Group Is a Radar Area Chart Group |
|
1041 |
AXISPARENT: Axis Size and Location |
|
1043 |
LEGENDXN: Legend Exception |
|
1044 |
SHTPROPS: Sheet Properties |
|
1045 |
SERTOCRT: Series Chart-Group Index |
|
1046 |
AXESUSED: Number of Axes Sets |
|
1048 |
SBASEREF: PivotTable Reference |
|
104A |
SERPARENT: Trendline or ErrorBar Series Index |
|
104B |
SERAUXTREND: Series Trendline |
|
104E |
IFMT: Number-Format Index |
|
104F |
POS: Position Information |
|
1050 |
ALRUNS: Text Formatting |
|
1051 |
AI: Linked Data |
|
105B |
SERAUXERRBAR: Series ErrorBar |
|
105D |
SERFMT: Series Format |
The first two fields in every BIFF record are record number and record length. Because these fields have the same offset and size in every BIFF record, they are not documented in the following descriptions. For more information about the record number and record length fields, see BIFF Record Information.
This record defines a 3-D chart group and also contains generic formatting information.
Record Data
|
Offset |
Name |
Size |
Contents |
|
4 |
anRot |
2 |
Rotation angle (0 to 360 degrees) |
|
6 |
anElev |
2 |
Elevation angle (90 to +90 degrees) |
|
8 |
pcDist |
2 |
Distance from eye to chart (0 to 100) |
|
10 |
pcHeight |
2 |
Height of plot volume relative to width and depth |
|
12 |
pcDepth |
2 |
Depth of points relative to width |
|
14 |
pcGap |
2 |
Space between series |
|
16 |
grbit |
2 |
Option flags |
The grbit field contains the following option flags.
|
Offset |
Bits |
Mask |
Name |
Contents |
|
0 |
0 |
01h |
fPerspective |
1 = use perspective transform |
|
0 |
1 |
02h |
fCluster |
1 = 3-D columns are clustered or stacked |
|
0 |
2 |
04h |
f3DScaling |
1 = use auto scaling |
|
0 |
3 |
08h |
(reserved) |
Reserved; must be zero |
|
0 |
4 |
10h |
(reserved) |
Reserved; must be one |
|
0 |
5 |
20h |
f2DWalls |
use 2D walls and gridlines |
|
0 |
72 |
FAh |
(reserved) |
Reserved; must be zero |
|
1 |
70 |
FFh |
(reserved) |
Reserved; must be zero |
This record specifies linked series data or text.
Record Data
|
Offset |
Name |
Size |
Contents |
|
4 |
id |
1 |
Link index identifier |
|
5 |
rt |
1 |
Reference type |
|
6 |
grbit |
2 |
Flags |
|
8 |
ifmt |
2 |
Index to number format record |
|
10 |
cce |
2 |
Size of rgce (in bytes) |
|
12 |
rgce |
var |
Parsed formula of link |
The grbit field contains the following option flags.
|
Offset |
Bits |
Mask |
Name |
Contents |
|
0 |
0 |
01h |
fCustomIfmt |
TRUE if this object has a custom number format; FALSE if number format is linked to data source |
|
0 |
1 |
02h |
(reserved) |
Reserved; must be zero |
|
0 |
5-2 |
3Ch |
st |
Source type (always zero) |
|
0 |
7-6 |
C0h |
(reserved) |
Reserved; must be zero |
|
1 |
7-0 |
FFh |
(reserved) |
Reserved; must be zero |
This record specifies rich-text formatting (bold, italic, font changes, etc.) within chart titles and data labels.
Record Data
|
Offset |
Name |
Size |
Contents |
|
4 |
cRuns |
2 |
Number of rich-text runs |
|
6 |
rgwRuns |
var |
Array of cRuns four-byte groups. The first two bytes in each group specifies the first character in the rich-text run. The second two bytes specifies the font index for the text run (see the FONT record for more information about this index). |
This record defines an area chart group.
Record Data
|
Offset |
Name |
Size |
Contents |
|
4 |
grbit |
2 |
format flags |
The grbit field contains the following option flags.
|
Offset |
Bits |
Mask |
Name |
Contents |
|
0 |
0 |
01h |
fStacked |
Series in this group are stacked |
|
0 |
1 |
02h |
f100 |
Each category is broken down as a percentage |
|
0 |
72 |
FCh |
(reserved) |
Reserved; must be zero |
|
1 |
70 |
FFh |
(reserved) |
Reserved; must be zero |
When fStacked is true, the value indicators (filled areas) are stacked one on top of the next. The f100 bit can be set only when the fStacked bit is set and indicates that each category is broken down into percentages.
This record describes the patterns and colors used in a filled area.
Record Data
|
Offset |
Name |
Size |
Contents |
|
4 |
rgbFore |
4 |
Foreground color: RGB value (high byte = 0) |
|
8 |
rgbBack |
4 |
Background color: RGB value (high byte = 0) |
|
12 |
fls |
2 |
Pattern |
|
14 |
grbit |
2 |
Format flags |
The grbit field contains the following option flags.
|
Offset |
Bits |
Mask |
Name |
Contents |
|
0 |
0 |
01h |
fAuto |
Automatic format |
|
0 |
1 |
02h |
fInvertNeg |
Foreground and background are swapped when the data value is negative |
|
0 |
72 |
FCh |
(reserved) |
Reserved; must be zero |
|
1 |
70 |
FFh |
(reserved) |
Reserved; must be zero |
The ATTACHEDLABEL record defines the data label type. The ATTACHEDLABEL record applies to the label data identified in the associated DATAFORMAT record.
Record Data
|
Offset |
Name |
Size |
Contents |
|
4 |
grbit |
2 |
Value label flags |
The grbit field contains the following option flags.
|
Offset |
Bits |
Mask |
Name |
Contents |
|
0 |
0 |
01h |
fShowValue |
1 = show the actual value of the data point |
|
0 |
1 |
02h |
fShowPercent |
1 = show value as a percent of the total. This bit applies only to pie charts |
|
0 |
2 |
04h |
fShowLabPct |
1 = show category label and value as a percentage (pie charts only). Should be 1 if fShowLabel and fShowPerecent are both 1. |
|
0 |
3 |
08h |
(reserved) |
Reserved; must be zero |
|
0 |
4 |
10h |
fShowLabel |
1 = show category label |
|
0 |
7-5 |
E0h |
(reserved) |
Reserved; must be zero |
|
1 |
70 |
FFh |
(reserved) |
Reserved; must be zero |
This record specifies the number of axes sets (1 = primary only, 2 = primary and secondary) used on the chart (3-D charts can only have primary axes).
Record Data
|
Offset |
Name |
Size |
Contents |
|
4 |
cAxes |
2 |
Number of axes sets |
This record defines the axis type.
Record Data
|
Offset |
Name |
Size |
Contents |
|
4 |
wType |
2 |
Axis type |
|
6 |
(reserved) |
16 |
Reserved; must be zero |
This record usually follows an AXIS record to define the axis line as it appears on the chart.
Record Data
|
Offset |
Name |
Size |
Contents |
|
4 |
id |
2 |
Axis line identifier: |
This record specifies the location and size of the chart axes, in units of 1/4000 of the chart area.
Record Data
|
Offset |
Name |
Size |
Contents |
|
4 |
iax |
2 |
Axis index (0 = main, 1 = secondary) |
|
6 |
x |
4 |
x coordinate of top left corner |
|
10 |
y |
4 |
y coordinate of top left corner |
|
14 |
dx |
4 |
length of x axis |
|
18 |
dy |
4 |
length of y axis |
This record defines a bar or column chart group.
Record Data
|
Offset |
Name |
Size |
Contents |
|
4 |
pcOverlap |
2 |
Space between bars (percent of bar width), default = 0 |
|
6 |
pcGap |
2 |
Space between categories (percent of bar width), default = 50 |
|
8 |
grbit |
2 |
Format flags |
The grbit field contains the bar chart display attributes as follows.
|
Offset |
Bits |
Mask |
Name |
Contents |
|
0 |
0 |
01h |
fTranspose |
1 = horizontal bars (bar chart) |
|
0 |
1 |
02h |
fStacked |
Stack the displayed values |
|
0 |
2 |
04h |
f100 |
Each category is displayed as a percentage |
|
0 |
73 |
FCh |
(reserved) |
Reserved; must be zero |
|
1 |
70 |
FFh |
(reserved) |
Reserved; must be zero |
When fStacked is true, the bars or columns within a category are stacked one on top of the next. The f100 bit can be set only when the fStacked bit is set, and indicates that each category is broken down into percentages.
The BEGIN record is a fixed length 4-byte record that indicates the beginning of a block of records that forms a data object. Every BEGIN record must have a corresponding END record. The BEGIN record consists of 10330000h.
This record defines the scaling options for a category or series axis.
Record Data
|
Offset |
Name |
Size |
Contents |
|
4 |
catCross |
2 |
Value axis/category crossing point (2-D charts only) |
|
6 |
catLabel |
2 |
Frequency of labels |
|
8 |
catMark |
2 |
Frequency of tick marks |
|
10 |
grbit |
2 |
Format flags |
The catCross field defines the point on the category axis where the value axis crosses. A value of 01 indicates that the value axis crosses to the left, or in the center, of the first category (depending on the value of bit 0 of the grbit field); a value of 02 indicates that the value axis crosses to the left or center of the second category, and so on. Bit 2 of the grbit field overrides the value of catCross when set to 1.
The catLabel field defines how often labels appear along the category or series axis. A value of 01 indicates that a category label will appear with each category, a value of 02 means a label appears every other category, and so on.
The catMark field defines how often tick marks appear along the category or series axis. A value of 01 indicates that a tick mark will appear between each category or series; a value of 02 means a label appears between every other category or series, etc.
The grbit field contains the following option flags.
|
Offset |
Bits |
Mask |
Name |
Contents |
|
0 |
0 |
01h |
fBetween |
Value axis crossing |
|
0 |
1 |
02h |
fMaxCross |
Value axis crosses at the far right |
|
0 |
2 |
04h |
fReverse |
Display categories in reverse order |
|
0 |
73 |
F8h |
(reserved) |
Reserved; must be zero |
|
1 |
70 |
FFh |
(reserved) |
Reserved; must be zero |
The CHART record marks the start of the chart data substream in the workbook BIFF stream. This record defines the location of the chart on the display and its overall size. The x and y fields define the position of the upper-left corner of the bounding rectangle that encompasses the chart. The position of the chart is referenced to the page.
The dx and dy fields define the overall size (the bounding rectangle) of the chart, including title, pointing arrows, axis labels, etc.
The position and size are specified in points (1/72 inch), using a fixed point format (two bytes integer, two bytes fraction).
Record Data
|
Offset |
Name |
Size |
Contents |
|
4 |
x |
4 |
x-position of upper-left corner |
|
8 |
y |
4 |
y-position of upper-left corner |
|
12 |
dx |
4 |
x-size |
|
16 |
dy |
4 |
y-size |
This record is the parent record for the chart group format description. Each chart group will have a separate CHARTFORMAT record; followed by a BEGIN record, the chart-group description, and an END record.
Record Data
|
Offset |
Name |
Size |
Contents |
|
4 |
(reserved) |
16 |
Reserved; must be zero |
|
20 |
grbit |
2 |
Format flags |
|
22 |
icrt |
2 |
Drawing order (0 = bottom of the z-order) |
The grbit field contains the following option flags.
|
Offset |
Bits |
Mask |
Name |
Contents |
|
0 |
0 |
01h |
fVaried |
Vary color for each data point |
|
0 |
71 |
FEh |
(reserved) |
Reserved; must be zero |
|
1 |
70 |
FFh |
(reserved) |
Reserved; must be zero |
This record is written by Microsoft Excel, but it is ignored. Applications writing chart BIFF do not need to write this record, and applications reading chart BIFF can ignore it.
This record specifies drop lines, hi-lo lines, or series lines on a line chart. If the chart has both drop lines and hi-lo lines, two CHARTLINE records will be present.
Record Data
|
Offset |
Name |
Size |
Contents |
|
4 |
id |
2 |
Drop lines/hi-lo lines |
The DATAFORMAT record contains the zero-based numbers of the data point and series. The subordinate records determine the format of the series or point defined by the DATAFORMAT record.
Record Data
|
Offset |
Name |
Size |
Contents |
|
4 |
xi |
2 |
Point number (FFFFh means entire series) |
|
6 |
yi |
2 |
Series index (file relative) |
|
8 |
iss |
2 |
Series number (as shown in name box -- S1, S2, etc.). This can be different from yi if the series order has been changed. |
|
10 |
grbit |
2 |
format flags |
The grbit field contains the following flags.
|
Offset |
Bits |
Mask |
Name |
Contents |
|
0 |
0 |
01h |
fXL4iss |
1 = use Microsoft Excel 4.0 colors for automatic formatting |
|
0 |
71 |
FEh |
(reserved) |
Reserved; must be zero |
|
1 |
70 |
FFh |
(reserved) |
Reserved; must be zero |
The DEFAULTTEXT record precedes a TEXT record to identify the text defined in the TEXT record as the default properties for certain chart items.
Record Data
|
Offset |
Name |
Size |
Contents |
|
4 |
id |
2 |
Object identifier for the text |
This record defines drop bars on a line chart. If the chart contains drop bars, the chart BIFF will contain two DROPBAR records. The first DROPBAR record corresponds to the up bar and the second DROPBAR record corresponds to the down bar.
Record Data
|
Offset |
Name |
Size |
Contents |
|
4 |
pcGap |
2 |
Drop bar gap width (0 to 100%) |
This record is a fixed-length 4-byte record that indicates the end of a data object. Every END record has a corresponding BEGIN record. The END record consists of 10340000h.
This record is the child of a TEXT record and defines a text font by indexing the appropriate font in the font table. The font table is built from FONT records.
Record Data
|
Offset |
Name |
Size |
Contents |
|
4 |
ifont |
2 |
Index number into the font table |
The FRAME record defines the border that is present around a displayed label as a rectangle. A displayed label can include the chart title, the legend (if not a regular rectangle), a category name, or a value amount.
Record Data
|
Offset |
Name |
Size |
Contents |
|
4 |
frt |
2 |
0 = regular rectangle/no border |
|
6 |
grbit |
2 |
Flags |
The frt field defines the format of the frame border, that is, a rectangle or a rectangle with a shadow along two sides. (The format of the rectangle line and the pattern of the background within the rectangle are defined by the subordinate LINEFORMAT and AREAFORMAT records.)
The grbit field contains the following option flags.
|
Offset |
Bits |
Mask |
Name |
Contents |
|
0 |
0 |
01h |
fAutoSize |
Microsoft Excel calculates size |
|
0 |
1 |
02h |
fAutoPosition |
Microsoft Excel calculates position |
|
0 |
72 |
FCh |
(reserved) |
Reserved; must be zero |
|
1 |
70 |
FFh |
(reserved) |
Reserved; must be zero |
The fAutoSize field indicates that the size of the frame is to be calculated by Microsoft Excel. The dx and dy fields in the parent record are ignored.
The fAutoPosition field indicates that the position of the frame is to be calculated by Microsoft Excel. The dx and dy fields in the parent record are ignored.
This record specifies the number-format index for an axis.
Record Data
|
Offset |
Name |
Size |
Contents |
|
4 |
ifmt |
2 |
Number-format index (number of the FORMAT record in the BIFF, begins at zero) |
The LEGEND record defines the location of the legend on the display and its overall size. The displayed legend contains all series on the chart.
Record Data
|
Offset |
Name |
Size |
Contents |
|
4 |
x |
4 |
x-position of upper-left corner |
|
8 |
y |
4 |
y-position of upper-left corner |
|
12 |
dx |
4 |
x-size |
|
16 |
dy |
4 |
y-size |
|
20 |
wType |
1 |
Type |
|
21 |
wSpacing |
1 |
Spacing |
|
22 |
grbit |
2 |
Option flags |
The x, y, dx, and dy fields are in units of 1/4000 of the chart area.
The x and y fields define the position of the upper-left corner of the bounding rectangle that encompasses the legend. The position of the legend is referenced to the document window. The dx and dy fields define the overall size (the bounding rectangle) of the legend.
The wType field defines the location of the legend relative to the plot rectangle of the chart. The wSpacing field is always 1 for Microsoft Excel.
The grbit field contains the following option flags.
|
Offset |
Bits |
Mask |
Name |
Contents |
|
0 |
0 |
01h |
fAutoPosition |
Automatic positioning (1 = legend is docked) |
|
0 |
1 |
02h |
fAutoSeries |
Automatic series distribution (TRUE in Microsoft Excel 5.0) |
|
0 |
2 |
04h |
fAutoPosX |
X positioning is automatic |
|
0 |
3 |
08h |
fAutoPosY |
Y positioning is automatic |
|
0 |
4 |
10h |
fVert |
1 = vertical legend (a single column of entries) |
|
0 |
75 |
E0h |
(reserved) |
Reserved; must be zero |
|
1 |
70 |
FFh |
(reserved) |
Reserved; must be zero |
This record specifies information about a legend entry which has been changed from the default legend-entry settings.
Record Data
|
Offset |
Name |
Size |
Contents |
|
4 |
iss |
2 |
Legend-entry index |
|
6 |
grbit |
2 |
Flags |
The grbit field contains the following option flags.
|
Offset |
Bits |
Mask |
Name |
Contents |
|
0 |
0 |
01h |
fDeleted |
TRUE if the legend entry has been deleted |
|
0 |
1 |
02h |
fLabel |
TRUE if the legend entry has been formatted |
|
0 |
7-2 |
FCh |
(reserved) |
Reserved; must be zero |
|
1 |
70 |
FFh |
(reserved) |
Reserved; must be zero |
Microsoft Excel uses three legend types. On a chart where the legend lists the series names, the iss field will contain FFFF. On a single-series chart formatted to vary by category (a pie chart or column autoformat number two, for example), the legend lists the categories and the iss field contains the category number. On a surface chart, the legend lists data ranges, and the iss field contains the legend-entry number, starting at zero for the bottom range.
This record defines a line chart group.
Record Data
|
Offset |
Name |
Size |
Contents |
|
4 |
grbit |
2 |
format flags |
The grbit field contains the following option flags.
|
Offset |
Bits |
Mask |
Name |
Contents |
|
0 |
0 |
01h |
fStacked |
Stack the displayed values |
|
0 |
1 |
02h |
f100 |
Each category is broken down as a percentage |
|
0 |
72 |
FCh |
(reserved) |
Reserved; must be zero |
|
1 |
70 |
FFh |
(reserved) |
Reserved; must be zero |
When fStacked is true, the value indicators within a category are stacked one on top of the next. The f100 bit can be set only when the fStacked bit is set, and indicates that each category is broken down into percentages.
This record defines the appearance of a line, such as an axis line or border.
Record Data
|
Offset |
Name |
Size |
Contents |
|
4 |
rgb |
4 |
Color of line; RGB value high byte must be set to zero |
|
8 |
lns |
2 |
Pattern of line |
|
10 |
we |
2 |
Weight of line |
|
12 |
grbit |
2 |
Format flags |
The grbit field contains the following option flags.
|
Offset |
Bits |
Mask |
Name |
Contents |
|
0 |
0 |
01h |
fAuto |
Automatic format |
|
0 |
1 |
02h |
(reserved) |
Reserved; must be zero |
|
0 |
2 |
04h |
fDrawTick |
1 = draw tick labels on this axis |
|
0 |
73 |
F8h |
(reserved) |
Reserved; must be zero |
|
1 |
70 |
FFh |
(reserved) |
Reserved; must be zero |
This record defines the color and shape of the line markers that appear on scatter and line charts.
Record Data
|
Offset |
Name |
Size |
Contents |
|
4 |
rgbFore |
4 |
Foreground color: RGB value (high byte = 0) |
|
8 |
rgbBack |
4 |
Background color: RGB value (high byte = 0) |
|
12 |
imk |
2 |
Type of marker |
|
14 |
grbit |
2 |
Format flags |
The rgbBack field describes the color of the marker's background, such as the center of the square, while the rgbFore field describes the color of the border or the marker itself. The imk field defines the type of marker.
The grbit field contains the following option flags.
|
Offset |
Bits |
Mask |
Name |
Contents |
|
0 |
0 |
01h |
fAuto |
Automatic color |
|
0 |
3-1 |
0Eh |
(reserved) |
Reserved; must be zero |
|
0 |
4 |
10h |
fNotShowInt |
1 = "background = none" |
|
0 |
5 |
20h |
fNotShowBrd |
1 = "foreground = none" |
|
0 |
7-6 |
C0h |
(reserved) |
Reserved; must be zero |
|
1 |
7-0 |
FFh |
(reserved) |
Reserved; must be zero |
This record links a TEXT record to an object on the chart or to the entire chart.
Record Data
|
Offset |
Name |
Size |
Contents |
|
4 |
wLinkObj |
2 |
Object text is linked to |
|
6 |
wLinkVar1 |
2 |
Link index 1, series number |
|
8 |
wLinkVar2 |
2 |
Link index 2, data point number |
The wLinkObj field specifies which object the text is linked to. The wLinkVar1 and wLinkVar2 fields define the linked object as a specific series number and data point in the series. The wLinkVar1 and wLinkVar2 fields have meaning only if the wLinkObj field equals 4.
This record defines the format for a picture attached to a data series or point.
Record Data
|
Offset |
Name |
Size |
Contents |
|
4 |
ptyp |
2 |
Picture type: |
|
6 |
cf |
2 |
Image format: |
|
8 |
grbit |
2 |
Option flags |
|
10 |
numScale |
8 |
Scaling value for pictures, units/picture (IEEE floating-point number) |
The grbit field contains the following option flags.
|
Offset |
Bits |
Mask |
Name |
Contents |
|
0 |
70 |
FFh |
env |
Environment from which the file was written: |
|
1 |
0 |
01h |
fFmtOnly |
Formatting only; no picture attached |
|
1 |
71 |
FEh |
(reserved) |
Reserved; must be zero |
If fFmtOnly is false, then an IMDATA record, which contains the picture itself, follows the PICF record. If fFmtOnly is true, which occurs only if the parent DATAFORMAT record refers to a single data point, then there is no IMDATA record following the PICF record. In this case, the picture specified for the entire series is used, with formatting specified by the PICF record. For more information about the IMDATA record, see IMDATA.
This record defines a pie chart group and also specifies the angle of the first slice in the pie.
Record Data
|
Offset |
Name |
Size |
Contents |
|
4 |
anStart |
2 |
Angle of the first pie slice expressed in degrees |
|
6 |
pcDonut |
2 |
0 = true pie chart |
The angle of the pie slice has a default value of zero and can be any value in the range of 0 to 359 (0000h to 0167h).
The distance of an open pie slice from the center of the pie chart is expressed as a percentage of the pie diameter. For example, if the percent = 33 (21h), the pie slice is one-third of the pie diameter away from the pie center.
Record Data
|
Offset |
Name |
Size |
Contents |
|
4 |
percent |
2 |
Distance of pie slice from center of pie |
This record immediately precedes a FRAME record. It indicates that the frame record that follows belongs to the plot area.
This record defines manual position information for the main-axis plot area, legend, and attached text (data labels, axis labels, and chart title). The record data depends on the record's use, as shown in the following sections.
This record is used very rarely and is usually not required; for most applications, the default size and position settings are sufficient. If your application writes chart BIFF, use the default settings whenever possible. To use the default plot area, set the fManPlotArea bit in the SHTPROPS record. To use a default legend position and size, set the fAutoPosition bit in the LEGEND record, and set the fAutoSize bit in the legend FRAME record. No other settings are required to use the default position for text (data labels, axis labels, and chart title).
The POS record is used only for the main axis. The record describes the plot-area bounding box (the plot-area bounding box includes the plot area, tick marks, and a small border around the tick marks). The fManPlotArea bit in the SHTPROPS record must be 1, or the POS record is ignored.
The top-left position, width, and height fields use units of 1/4000 of the chart area.
Record Data
|
Offset |
Name |
Size |
Contents |
|
4 |
mdTopLt |
2 |
Must be 2 |
|
6 |
mdBotRt |
2 |
Must be 2 |
|
8 |
x1 |
4 |
x coordinate of bounding box top left corner |
|
12 |
y1 |
4 |
y coordinate of bounding box top left corner |
|
16 |
x2 |
4 |
width of the bounding box |
|
20 |
y2 |
4 |
height of the bounding box |
The POS record describes the legend position and size.
Record Data
|
Offset |
Name |
Size |
Contents |
|
4 |
mdTopLt |
2 |
Must be 5 |
|
6 |
mdBotRt |
2 |
1 = use x2 and y2 for legend size |
|
8 |
x1 |
4 |
x coordinate of legend top left corner, in units of 1/4000 of the chart area |
|
12 |
y1 |
4 |
y coordinate of legend top left corner, in units of 1/4000 of the chart area |
|
16 |
x2 |
4 |
width of the legend, in points (1/72 inch) |
|
20 |
y2 |
4 |
height of the legend, in points |
The POS record sets the chart title position as an offset from the default position, in units of 1/4000 of the chart area.
Record Data
|
Offset |
Name |
Size |
Contents |
|
4 |
mdTopLt |
2 |
Must be 2 |
|
6 |
mdTopRt |
2 |
Must be 2 |
|
8 |
x1 |
4 |
offset from default horizontal position |
|
12 |
y1 |
4 |
offset from default vertical position |
|
16 |
x2 |
4 |
ignored (you cannot size the chart title) |
|
20 |
y2 |
4 |
ignored |
The POS record sets the axis title position as an offset from the default position.
Record Data
|
Offset |
Name |
Size |
Contents |
|
4 |
mdTopLt |
2 |
Must be 2 |
|
6 |
mdTopRt |
2 |
Must be 2 |
|
8 |
x1 |
4 |
offset perpendicular to the axis, in units of 1/1000 of the plot-area bounding box |
|
12 |
y1 |
4 |
offset parallel to the axis, in units of 1/1000 of the axis length |
|
16 |
x2 |
4 |
ignored (you cannot size the axis title) |
|
20 |
y2 |
4 |
ignored |
The POS record sets the label position as an offset from the default position.
Record Data
|
Offset |
Name |
Size |
Contents |
|
4 |
mdTopLt |
2 |
Must be 2 |
|
6 |
mdTopRt |
2 |
Must be 2 |
|
8 |
x1 |
4 |
Pie charts: offset angle from the default, in radians. |
|
12 |
y1 |
4 |
Pie charts: radial offset, in units of 1/1000 of the pie radius. |
|
16 |
x2 |
4 |
ignored (you cannot size the data label) |
|
20 |
y2 |
4 |
ignored |
This record defines a radar chart group.
Record Data
|
Offset |
Name |
Size |
Contents |
|
4 |
grbit |
2 |
Option flags |
The grbit field contains the following option flags.
|
Offset |
Bits |
Mask |
Name |
Contents |
|
0 |
0 |
01h |
fRdrAxLab |
= 1, chart contains radar axis labels |
|
0 |
71 |
FEh |
(reserved) |
Reserved; must be zero |
|
1 |
70 |
FFh |
(reserved) |
Reserved; must be zero |
This record defines a radar area chart group.
Record Data
|
Offset |
Name |
Size |
Contents |
|
4 |
grbit |
2 |
Option flags |
The grbit field contains the following option flags.
|
Offset |
Bits |
Mask |
Name |
Contents |
|
0 |
0 |
01h |
fRdrAxLab |
1 if chart contains radar axis labels |
|
0 |
71 |
FEh |
(reserved) |
Reserved; must be zero |
|
1 |
70 |
FFh |
(reserved) |
Reserved; must be zero |
This record specifies the PivotTable reference used for the chart.
Record Data
|
Offset |
Name |
Size |
Contents |
|
4 |
rwFirst |
2 |
First PivotTable row |
|
6 |
rwLast |
2 |
Last PivotTable row |
|
8 |
colFirst |
2 |
First PivotTable column |
|
10 |
colLast |
2 |
Last PivotTable column |
This record has no record data field. If the SCATTER record is present in the Chart BIFF, it signifies that the chart group is an XY (scatter) chart group.
This record defines series error bars.
Record Data
|
Offset |
Name |
Size |
Contents |
|
4 |
sertm |
1 |
Error-bar type: |
|
5 |
ebsrc |
1 |
Error-bar value source: |
|
6 |
fTeeTop |
1 |
TRUE if the error bars are T-shaped (have a line on the top and bottom) |
|
7 |
(reserved) |
1 |
Reserved; must be 1 |
|
8 |
numValue |
8 |
IEEE number; specifies the fixed value, percentage, or number of standard deviations for the error bars |
|
16 |
cnum |
2 |
Number of values or cell references used for custom error bars |
This record defines a series trendline.
Record Data
|
Offset |
Name |
Size |
Contents |
|
4 |
regt |
1 |
Regression type: |
|
5 |
ordUser |
1 |
Polynomial order or moving average period |
|
6 |
numIntercept |
8 |
IEEE number; specifies forced intercept (#NA if no intercept is specified) |
|
14 |
fEquation |
1 |
TRUE if the equation is displayed |
|
15 |
fRSquared |
1 |
TRUE if the R-squared value is displayed |
|
16 |
numForecast |
8 |
IEEE number; specifies number of periods to forecast forward |
|
24 |
numBackcast |
8 |
IEEE number; specifies number of periods to forecast backward |
This record specifies series formatting information.
Record Data
|
Offset |
Name |
Size |
Contents |
|
0 |
grbit |
2 |
flags |
The grbit field contains the following option flags.
|
Offset |
Bits |
Mask |
Name |
Contents |
|
0 |
0 |
01h |
fSmoothedLine |
TRUE if the line series has a smoothed line |
|
0 |
7-1 |
FEh |
(reserved) |
Reserved; must be zero |
|
1 |
7-0 |
FFh |
(reserved) |
Reserved; must be zero |
This record describes the series of the chart, and contains the type of data and number of data fields that make up the series. Series can contain 4000 points in Microsoft Excel version 5.
The sdtX and sdtY fields define the type of data that is contained in this series. At present, the two types of data used in Microsoft Excel chart series are numeric and text (date and sequence information is not used). The cValx and cValy fields contain the number of cell records in the series.
Record Data
|
Offset |
Name |
Size |
Contents |
|
4 |
sdtX |
2 |
Type of data in categories |
|
8 |
sdtY |
2 |
Type of data in values |
|
10 |
cValx |
2 |
Count of categories |
|
12 |
cValy |
2 |
Count of values |
This record is subordinate to the second CHARTFORMAT (overlay) record in a file and defines the series that are displayed as the overlay to the main chart. The first CHARTFORMAT (main chart) record in a file does not require a SERIESLIST record because all series, except those specified for the overlay, are included in the main chart.
Record Data
|
Offset |
Name |
Size |
Contents |
|
4 |
cser |
2 |
Count of series (size of rgiser) |
|
6 |
rgiser |
var |
List of series numbers (words) |
The value of the id field determines the assignment of the text field.
Record Data
|
Offset |
Name |
Size |
Contents |
|
4 |
id |
2 |
Text identifier: |
|
6 |
cch |
1 |
Length of text field |
|
7 |
rgch |
var |
The series text string |
Values greater than zero in the id field do not apply to Microsoft Excel.
This record indicates the series index for the series that the trendline or error bar is attached to. The series index is the number of the series in the BIFF (starting with series one).
Record Data
|
Offset |
Name |
Size |
Contents |
|
4 |
series |
2 |
Series index for the series that the trendline or error bar is attached to |
This record is part of the series specifications and indicates the chart-group index for the series. The chart-group index specifies the number of the chart group (specified by a CHARTFORMAT record) in the BIFF, starting with chart group zero.
Record Data
|
Offset |
Name |
Size |
Contents |
|
0 |
chartgroup |
2 |
Chart-group index |
This record specifies chart sheet properties.
Record Data
|
Offset |
Name |
Size |
Contents |
|
4 |
grbit |
2 |
Property flags |
|
6 |
mdBlank |
1 |
Empty cells plotted as: |
The grbit field contains the following option flags.
|
Offset |
Bits |
Mask |
Name |
Contents |
|
0 |
0 |
01h |
fManSerAlloc |
1 = chart type has been manually formatted (changed from the default) |
|
0 |
1 |
02h |
fPlotVisOnly |
1 = plot visible cells only |
|
0 |
2 |
04h |
fNotSizeWith |
1 = do not size chart with window |
|
0 |
3 |
08h |
fManPlotArea |
0 = use default plot area dimensions |
|
0 |
7-4 |
F0h |
(reserved) |
Reserved; must be zero |
|
1 |
7-0 |
FFh |
(reserved) |
Reserved; must be zero |
This record defines a surface chart group.
Record Data
|
Offset |
Name |
Size |
Contents |
|
4 |
grbit |
2 |
Option flags |
The grbit field contains the following option flags.
|
Offset |
Bits |
Mask |
Name |
Contents |
|
0 |
0 |
01h |
fFillSurface |
= 1, chart contains color fill for surface |
|
0 |
71 |
FEh |
(reserved) |
Reserved; must be zero |
|
1 |
70 |
FFh |
(reserved) |
Reserved; must be zero |
This record is used in conjunction with several child records (which further define the text displayed on the chart) to define the alignment, color, position, size, and so on, of text fields that appear on the chart. The fields in this record have meaning according to the TEXT record's parent (CHART, LEGEND, or DEFAULTTEXT).
Record Data
|
Offset |
Name |
Size |
Contents |
|
4 |
at |
1 |
Horizontal alignment of the text (1 = left, 2 = center, 3 = bottom, 4 = justify) |
|
5 |
vat |
1 |
Vertical alignment of the text (1 = top, 2 = center, 3 = bottom, 4 = justify) |
|
6 |
wBkgMode |
2 |
Display mode of the background |
|
8 |
rgbText |
4 |
Color of the text; RGB value (high byte = 0) |
|
12 |
x |
4 |
x-position of the text in 1/4000 of chart area |
|
16 |
y |
4 |
y-position of the text in 1/4000 of chart area |
|
20 |
dx |
4 |
x-size of the text in 1/4000 of chart area |
|
24 |
dy |
4 |
y-size of the text in 1/4000 of chart area |
|
28 |
grbit |
2 |
Display flags |
The option flags in the grbit field (like the fields themselves) have meaning according to the TEXT record's parent. The grbit field contains the following option flags.
|
Offset |
Bits |
Mask |
Name |
Contents |
|
0 |
0 |
01h |
fAutoColor |
1 = automatic color |
|
0 |
1 |
02h |
fShowKey |
If text is an attached data label: |
|
0 |
2 |
04h |
fShowValue |
1 = text of label is the value of the data point |
|
0 |
3 |
08h |
fVert |
1 = text is not horizontal |
|
0 |
4 |
10h |
fAutoText |
1 = use automatically generated text string |
|
0 |
5 |
20h |
fGenerated |
1 = default or unmodified |
|
0 |
6 |
40h |
fDeleted |
1= an Automatic text label has been deleted by the user |
|
0 |
7 |
80h |
fAutoMode |
1 = Background is set to Automatic |
|
1 |
20 |
07h |
rot |
0 = no rotation (text appears left-to-right) |
|
1 |
3 |
08h |
fShLabPct |
1 = show category label and value as a percentage (pie charts only) |
|
1 |
4 |
10h |
fShowPct |
1 = show value as a percent. This bit applies only to pie charts |
|
1 |
7-5 |
E0h |
(reserved) |
Reserved; must be zero |
This record defines tick mark and tick label formatting.
Record Data
|
Offset |
Name |
Size |
Contents |
|
4 |
tktMajor |
1 |
Type of major tick mark |
|
5 |
tktMinor |
1 |
Type of minor tick mark |
|
6 |
tlt |
1 |
Tick label position relative to axis line |
|
7 |
wBkgMode |
1 |
Background mode: |
|
8 |
rgb |
4 |
Tick-label text color; RGB value, high byte = 0 |
|
12 |
(reserved) |
16 |
Reserved; must be zero |
|
28 |
grbit |
2 |
Display flags |
The grbit field contains the following option flags.
|
Offset |
Bits |
Mask |
Name |
Contents |
|
0 |
0 |
01h |
fAutoCo |
Automatic text color |
|
0 |
1 |
02h |
fAutoMode |
Automatic text background |
|
0 |
42 |
1Ch |
rot |
= 0 no rotation (text appears left-to-right) |
|
0 |
5 |
20h |
fAutoRot |
Automatic rotation |
|
0 |
76 |
C0h |
(reserved) |
Reserved; must be zero |
|
1 |
70 |
FFh |
(reserved) |
Reserved; must be zero |
Microsoft Excel writes this record, but its value is always zero.
Applications writing BIFF do not need to write this record. If your application writes this record, the wUnits field must be zero.
Record Data
|
Offset |
Name |
Size |
Contents |
|
4 |
wUnits |
2 |
Always zero |
This record defines the value axis.
Record Data
|
Offset |
Name |
Size |
Contents |
|
4 |
numMin |
8 |
Minimum value on axis |
|
12 |
numMax |
8 |
Maximum value on axis |
|
20 |
numMajor |
8 |
Value of major increment |
|
28 |
numMinor |
8 |
Value of minor increment |
|
36 |
numCross |
8 |
Value where category axis crosses |
|
44 |
grbit |
2 |
Format flags |
All 8-byte numbers in the preceding table are IEEE floating-point numbers.
The numMin field defines the minimum numeric value that appears along the value axis. This field is all zeros if Auto Minimum is selected on the Scale tab of the Format Axis dialog box. The numMax field defines the maximum value displayed along the value axis and is all zeros if Auto Maximum is selected.
The numMajor field defines the increment (unit) of the major value divisions (gridlines) along the value axis. The numMajor field is all zeros if Auto Major Unit is selected on the Scale tab of the Format Axis dialog box. The numMinor field defines the minor value divisions (gridlines) along the value axis and is all zeros if Auto Minor Unit is selected.
The numCross field defines the value along the value axis at which the category axis crosses. This field is all zeros if Auto Category Axis Crosses At is selected.
The grbit field contains the following option flags.
|
Offset |
Bits |
Mask |
Name |
Contents |
|
0 |
0 |
01h |
fAutoMin |
Automatic minimum selected |
|
0 |
1 |
02h |
fAutoMax |
Automatic maximum selected |
|
0 |
2 |
04h |
fAutoMajor |
Automatic major unit selected |
|
0 |
3 |
08h |
fAutoMinor |
Automatic minor unit selected |
|
0 |
4 |
10h |
fAutoCross |
Automatic category crossing point selected |
|
0 |
5 |
20h |
fLogScale |
Logarithmic scale |
|
0 |
6 |
40h |
fReverse |
Values in reverse order |
|
0 |
7 |
80h |
fMaxCross |
Category axis to cross at maximum value |
|
1 |
70 |
FFh |
(reserved) |
Reserved; must be zero |