The graph control gives us an easy way to graph data in our Web page:
	_____________________________
          |                             |
          |                             |
          |            _____            |
          |           |     |           |
          |      _____|     |_____      |
          |_____|     |     |     |     |
          |     |     |     |     |_____|
          |     |     |     |     |     |
          |     |     |     |     |     |
          |_____|_____|_____|_____|_____|
To see how this works, we add a new graph control, using its class ID in the <OBJECT> tag:
<HTML>
    <HEAD>
    <TITLE>OCX Control Page</TITLE>
    </HEAD>
    <BODY LANGUAGE = VBScript ONLOAD = "Page_Initialize">
    <CENTER>
    <H1>OCX Control Page</H1>
    </CENTER>
        .
        .
        .
    <!- Graph>
    <PRE>
--> Graph1:  <OBJECT CLASSID="clsid:0842d100-1e19-101b-9aaf-1a1626551e7c"
                 HEIGHT=100 WIDTH=300 ID=Graph1></OBJECT>
    </PRE>
        .
        .
        .
The ID we've given our graph control is Graph1. Let's say that we have this data to plot:
Point   Value
                -----   -----
                  1      2
                  2      4
                  3      5
                  4      3
We plot it by repeatedly filling the graph control's GraphData property with these values. We place the first value in GraphData using this new code in the Page_Initialize subroutine:
Page_Initialize
--> Graph1.GraphData = 2
        .
        .
        .
End Sub
Next, we fill GraphData with the next data point to graph:
Page_Initialize
    Graph1.GraphData = 2
--> Graph1.GraphData = 4
        .
        .
        .
End Sub
The graph control automatically increments our position along the x axis every time we (re)fill the GraphData property. In this way, we place all the into the graph:
Page_Initialize
    Graph1.GraphData = 2
    Graph1.GraphData = 4
--> Graph1.GraphData = 5
--> Graph1.GraphData = 3
        .
        .
        .
End Sub
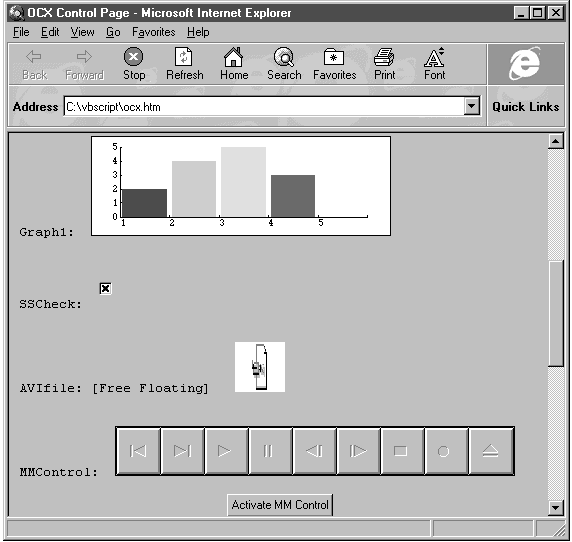
Adding the data to the graph was easy; the result appears in Figure 6.2.

Figure 6.2 Our graph and other new ActiveX controls.
We'll look into other graph types soon, but for now let's continue our overview of ActiveX controls by looking at 3-D checkboxes.