Steven Pratschner,
Microsoft Consulting Services
September 30, 1997
Click to copy the ExtCounters sample files for this technical article.
Click to copy the FinSrv sample files for this technical article.
Click to copy the RegPctrs sample files for this technical article.
Many applications, especially server applications, are increasing in complexity, often to the point where they are difficult to understand and to manage. To aid in analyzing complex applications, the Windows NT® Performance Monitor provides a general, customizable mechanism to view various counters and other metrics within a running application. This article describes a set of COM interfaces, C++ code, and utility components that make it easy for the developer to add customized counters to Performance Monitor. This article begins by briefly describing the complexities of the native Performance Monitor interface, introduces some new COM interfaces, macros and utilities, and finally leads the reader through an example where we add several counters to a program.
There are two primary benefits to using Performance Monitor to instrument an application. First, Performance Monitor can be used to tune an application. Second, a developer can use custom performance monitor counters to diagnose problems, thereby producing a higher quality application.
Performance Monitor displays data in terms of objects and counters. Objects included with Windows NT include Process and Memory. Counters for the Process object include the number of running threads and the process's CPU utilization. An application integrates with Performance Monitor by providing objects and counters that are specific to the application. Because the counters are application-specific, they can be used to monitor virtually any aspect of a running application. A common use of custom performance monitor counters is to track the amount of resources used by an application. Information gathered through the custom counters can then be used to tune the application. For example, counters can be used to monitor the number of users contending for a shared resource within the application. By viewing the counter data using Performance Monitor, a developer can determine when access to the shared resource becomes a bottleneck in the application. At this point, the developer may choose to expand the number of resources available to the connected users.
Custom Performance Monitor counters can also used to aid in debugging. Counters can be used to track conditions in the application without having to run the application under a debugger or add case-specific tracking code. For example, a common problem encountered when developing COM applications is object reference counting. Too many reference counts results in a COM object staying in memory longer than it should while too few reference counts results in objects being destroyed prematurely. Custom counters can be used to diagnose these situations. Counters can be added that track outstanding object references within a COM server. By watching the reference counts through Performance Monitor, a developer can identify portions of the application that include reference counting problems.
Using Performance Monitor as an additional tuning and debugging tool helps you build better quality applications. As a result, these applications will have a substantially lower total cost of ownership (TCO) in the long run.
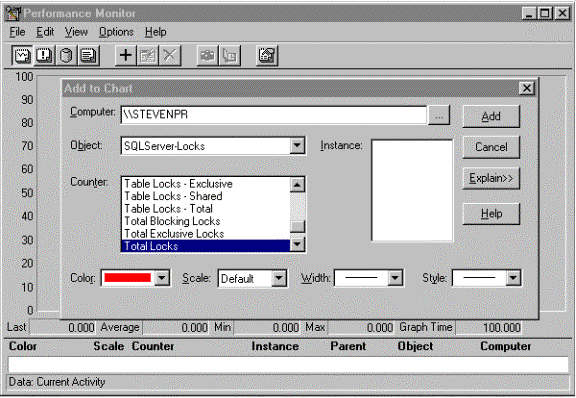
Microsoft® SQL Server™ is an excellent example of an application that makes extensive use of custom Performance Monitor counters. SQL Server provides several objects and counters that can be used by administrators and developers to tune the server. For example, counters can be used to determine the number and types of locks held on tables, the number of connections to the server, and the effectiveness of the procedure cache. Figure 1 shows some of the counters for the SQLServer-Locks object.

Figure 1.
The Windows NT Performance Monitor provides facilities that allow applications to add custom performance counters. Performance Monitor displays these counters in the same way that it displays the counters provided by the operating system.
Much of the work required to implement custom counters is the same for all applications. This article describes a set of COM interfaces, C++ classes, and utility components that provide the code that is common to all applications. This leaves the developer to concentrate on counter design and on the specifics of gathering the counter data.
Adding custom counters requires several steps. This section describes those steps, provides a brief overview of the performance monitor interface, and then describes the framework we've developed for making the process of adding custom counters easier.
When adding custom performance monitor counters, a developer must first determine what aspects of the application to measure. For example, a multiuser NT Server application may want to monitor how many users are connected to the application. After the counters are designed, the following steps must be followed to display the counters using performance monitor:
These steps are described in detail in the following sections. Figure 2 shows the architecture of Performance Monitor with respect to custom application counters.
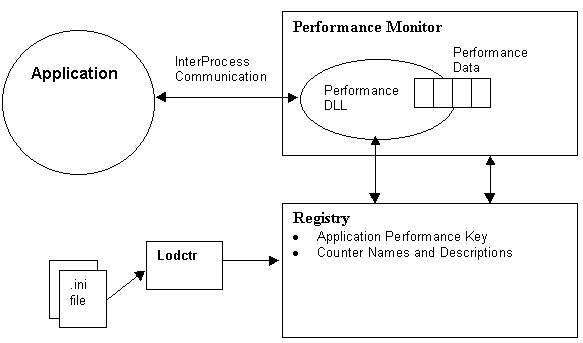
Figure 2.
Performance Monitor uses the registry to determine which applications provide custom counters. Those applications that provide custom counters include a Performance key under their application key. Figure 3 shows the Performance key for Microsoft SQL Server. This key is located in HKEY_LOCAL_MACHINE\SYSTEM\CurrentControlSet\Services\MSSQLServer.
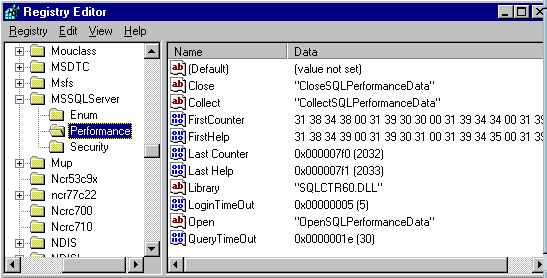
Figure 3.
The names and descriptions of each application's custom counters are also stored in the registry. The list of all available counters is found under HKEY_LOCAL_MACHINE\SOFTWARE\Microsoft\Windows NT\CurrentVersion\Perflib. Performance monitor uses this information to display a list of available counters in its user interface. Developers use a tool called lodctr to add counter names and descriptions to the registry. The input to lodctr is an .ini file that provides the name and help text for each custom counter supported by the application. A sample .ini file is provided in Figure 4.
[info]
drivername=FINSERVER
symbolfile=FinPerf.h
[languages]
009=English
[text]
FINSERVEROBJ_009_NAME=FinancialServer
FINSERVEROBJ_009_HELP=The top level FinServer object.
ACTIVESESSIONS_009_NAME=Active Users
ACTIVESESSIONS_009_HELP=The number of active users connected to the server.
MODULELOCKS_009_NAME=Module Locks
MODULELOCKS_009_HELP=The number of DCOM object locks in the FinServer.
OPENDBCONNECTS_009_NAME=Open ODBC connections
OPENDBCONNECTS_009_HELP=The number of open ODBC connections in the FinServer.
Figure 4.
In addition to the entries made, lodctr also edits the application's Performance key to add values used by the Performance DLL during the collection process.
Each application that supplies custom counters must provide a Performance DLL. Performance Monitor calls exported functions of this DLL during the data collection process. The name and location of this DLL are kept in the registry under the application's Performance key (Figure 3).
Each Performance DLL must export three functions. These functions are called to initialize the Performance DLL, collect counter values from it, and perform cleanup tasks before unloading it. The names of these functions can vary and are specified in the Open, Close, and Collect values under the application's Performance key in the registry (Figure 3).
The Open function is called when the user selects "Add to Chart" from the "Edit" menu (or selects the + sign on the toolbar) in Performance Monitor. The primary purpose of the Open function is to give the Performance DLL a chance to perform initialization tasks before the data collection process begins.
Typical tasks that are performed in the Open function include establishing a communication mechanism with the application being monitored, reading counter indexes from the registry, and initializing the data structures that will be used in the collection process.
The Collect function is called each time Performance Monitor needs to obtain updated counter values. A Performance DLL returns counter values to Performance Monitor by initializing a number of data structures that define the characteristics of the counters and their current values. These structures are placed in memory supplied by Performance Monitor. The structures used in the collection process are defined in the winperf.h header file. The layout of these structures in memory is shown in Figure 5. The primary data structures from winperf.h are described briefly below.

Figure 5.
PERF_OBJECT_TYPE
This structure defines a Performance Monitor object. Examples of objects supplied by Windows NT are Processor, Memory, and Cache.
PERF_COUNTER_DEFINITION
The characteristics of a custom counter are specified in the PERF_COUNTER_DEFINITION structure. Information in this structure includes the data type of the counter, its size, and its default scale.
PERF_COUNTER_BLOCK
The PERF_COUNTER_BLOCK structure marks the beginning of the actual counter values. The only field in this structure is a size field that specifies the amount of memory taken up by all of the counter values.
The Close function is called when Performance Monitor exits. The Close function gives the Performance DLL a chance to perform cleanup tasks. These typically include closing the communication mechanism with the application and freeing any data structures allocated during the collection process.
Because the Performance DLL is loaded in the Performance Monitor address space, an inter-process communication mechanism must be established between the Performance DLL and the application being monitored. Typically the communication mechanism is initialized in the Performance DLL's Open function and used in the Collect function to retrieve the counter values from the application.
Any of the available Win32 inter-process communication mechanisms can be used. These include memory-mapped files, named pipes, and COM interface calls. Performance Monitor does not define a standard communication mechanism between Performance DLLs and applications. It is up to the developer to implement a communication scheme for each application that supports custom counters.
The final step in implementing custom performance counters is to collect the performance data itself. The application must keep track of the data values for each of its counters and give the values to the Performance DLL on demand. The method used to transfer the values depends on the communication mechanism chosen in the previous step.
As can be seen from the previous section, adding custom performance monitor counters to an application is a complex process. In addition, much of the code required to add the counters is the same for all applications. The components described in this article make it significantly easier to add custom performance monitor counters to an application.
Much of the code that is common to all applications is supplied in a generic Performance DLL and a registration component. COM interfaces have been designed that provide a higher level interface than the native Performance Monitor API. Instead of calling the Performance Monitor API directly, the developer implements a set of components that support the COM interfaces described in this article. The required registry entries are made by calling a registration component during application initialization. The developer is left to concentrate on counter design and on the specifics of gathering the counter data.
This section describes how these components are used and how they fit into the Performance Monitor architecture (see Figure 6).
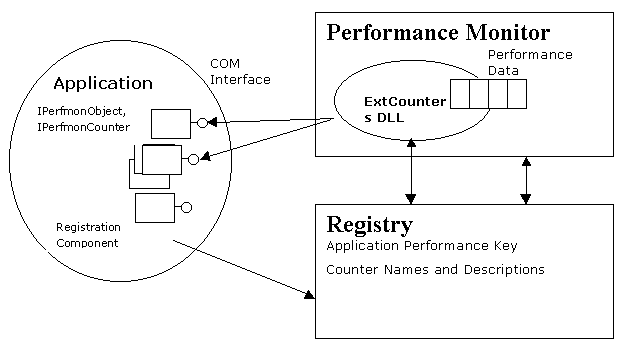
Figure 6.
This section describes the COM interfaces that have been designed to provide a higher level interface than the native Performance Monitor API. These interfaces are IPerfmonObject and IPerfmonCounter. Any application that supports custom counters must supply a set of components that implement these interfaces. The generic Performance DLL ExtCounters (described below) calls these interfaces during the data collection process and the registration component RegPerfCounters (described below) calls these interfaces during registration.
There are several advantages to using these interfaces. First, when using these interfaces, the developer does not need to be concerned with the details of the Performance Monitor API. These details include laying out the performance monitor structures in memory and defining a communication mechanism between the Performance DLL and the application. Second, because the generic Performance DLL communicates with the application through COM interfaces, the components used to collect the performance data can be written in any language. This approach makes it easier for applications written in languages like Visual Basic® to support custom performance monitor counters.
The IPerfmonObject interface represents a performance monitor object. Examples of performance monitor objects included with NT are Process and Thread. SQL Server adds custom objects including SQL Server-Procedure Cache and SQL Server-Log. In the approach presented in this document, each application exposes a Performance Monitor object.
The IPerfmonCounter interface represents a custom performance monitor counter. These counters hold the data values being monitored within the application. Examples of counters from the NT Process object include Thread Count and Handle Count. A Performance Monitor object can have any number of counters.
We have also provided a set of C++ classes and macros to make it easy to build components that expose the interfaces described above. The classes IPerfmonObjectImpl and IPerfmonCounterImpl provide default implementations for each member of IPerformObject and IPerfmonCounter. These classes are described later in the document.
The following sections provide explanations for each member of IPerfmonObject and IPerfmonCounter. As described above, the default implementations provide by IPerfmonObjectImpl and IPerfmonCounterImpl are generally sufficient.
Each application implements one component that exposes this interface. This component is referred to as the application's collection component throughout this document. The collection component represents the application's performance monitor object. This interface provides the top-level connection to the Performance DLL. The definition of IPerfmonObject is:
interface IPerfmonObject : IDispatch
{
   HRESULT GetName([out, retval] BSTR *pName);
   HRESULT GetHelp([out, retval] BSTR *pHelp);
   HRESULT GetIndex([out, retval] long *pIndex);
   HRESULT GetNumCounters([out, retval] long *pNumCounters);
   HRESULT GetCounters([out, retval] IUnknown **pCounters);
};
Figure 7.
Returns the name of the Performance Monitor object. This name is added to the list of Performance Monitor objects in the registry during the registration process. The name is then displayed in the "Object" dropdown on the "Add To Chart" dialog box in the Performance Monitor user interface (Figure 8).
Returns the help text for the Performance Monitor object. Like the name, an object's help text is entered in the registry and displayed in the Performance Monitor user interface. The help text is shown when the user chooses the "Explain" button in the "Add To Chart" dialog (Figure 8).
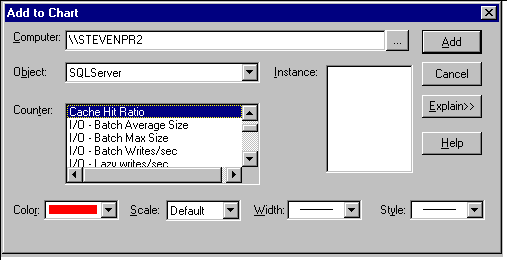
Figure 8.
Performance Monitor requires that each object and counter be identified by a unique index. This index is stored in the registry along with the object's name and help text. Index values are always even numbers. This method returns the index for the application's Performance Monitor object.
Returns the number of custom counters for this object.
This method returns a COM enumeration containing IPerfmonCounter interface pointers to each of the object's counters.
An application implements one component that exposes this interface for each custom counter it provides.
Both the ExtCounters DLL and the registration component use these interfaces to gather information about a custom counter. The definition of IPerfmonCounter is:
interface IPerfmonCounter : IDispatch
{
   HRESULT GetName([out, retval] BSTR *pName);
   HRESULT GetHelp([out, retval] BSTR *pHelp);
   HRESULT GetIndex([out, retval] long *pIndex);
   HRESULT GetDataType([out, retval] short *pDataType);
   HRESULT Collect([out, retval] VARIANT *pVariant);
};
Figure 9.
Returns the name of the custom counter. As with Performance Monitor objects, the name of each counter is stored in the registry and displayed in the Performance Monitor user interface. The "Counter" list box on the "Add To Chart" dialog lists the custom counters for the select object (Figure 7).
Returns the counter's help text. The help text is stored in the registry and displayed in the Performance Monitor user interface when a user chooses the "Explain" button (Figure 7).
Returns the counter's unique index.
This member returns the data type of the counter. Data types are identified using the values from the VARTYPE enumeration used in OLE Automation. For example, if the counter is a 4-byte integer, this member would return VT_I4.
This member is called by the Performance DLL to collect the latest value for the custom counter. The return type of this member is VARIANT. VARIANTs are used to provide flexibility in the type of data that can be returned. The implementation of Collect is responsible for correctly initializing the VARIANT with the appropriate type and data values. The Performance DLL will look at the type of data in the VARIANT and extract the data before passing it onto Performance Monitor.
We have provided two C++ classes that make it easy to implement IPerfmonObject and IPerfmonCounter. The class IPerfmonObjectImpl provides an implementation of IPerfmonObject and IPerfmonCounterImpl provides an implementation of IPerfmonCounter. The goal in providing these classes is to minimize the amount of coding required to add custom performance monitor counters to an application. These classes are designed to fit easily into projects that implement COM components using ATL.
IPerfmonObjectImpl provides a default implementation of the IPerfmonObject interface. This class fits into the ATL class hierarchy that is used to build COM components. IPerfmonObjectImpl uses ATL's concept of a map to allow developers to easily specify the custom counters for their application. Typically, a developer will derive a class from IPerfmonObjectImpl and specify a map that describes the custom counters. Figure 10 provides an example of a class derived from IPerfmonObjectImpl. The sections of code that relate to IPerfmonObjectImpl are shown in bold.
class CMySrvCounters :
   public CComObjectRootEx<CComMultiThreadModel>,
   public CComCoClass<CMySrvCounters, &CLSID_CMySrvCounters>,
   public IPerfmonObjectImpl<&LIBID_MYSRVSERVERLib>
{
public:

DECLARE_REGISTRY_RESOURCEID(IDR_MYSRVCOUNTERS)
BEGIN_COM_MAP(CMySrvCounters)
   COM_INTERFACE_ENTRY(IPerfmonObject)
   COM_INTERFACE_ENTRY(IDispatch)
END_COM_MAP()
BEGIN_COUNTER_MAP(IPerfmonCounterImpl)
COUNTER_ENTRY_LONG("Number of Users",
                        "The number of users connected to the application",
                        &m_numUsers)
COUNTER_ENTRY_LONG_FUNC("Number of ODBC Connections",
                        "The number of ODBC connections the application has open",
                        GetNumODBCConnections)
END_COUNTER_MAP()
};
Figure 10.
This class uses a counter map to implement two custom performance counters. The counter map works like ATL's COM map. Specifying the map will be very familiar to ATL programmers following ATL's style. The counter map begins and ends with the BEGIN_COUNTER_MAP() and END_COUNTER_MAP() entries respectively. BEGIN_COUNTER_MAP() has a parameter that specifies the type of object to create to represent a counter. Typically, this parameter will be IPerfmonCounterImpl. This is described in more detail in the following section.
We have provided two macros for specifying the custom counters themselves. Using these macros, a developer can add a custom counter with very little coding. COUNTER_ENTRY_LONG() is used to specify a counter whose latest value is always kept in a variable. If more flexibility is needed, COUNTER_ENTRY_LONG_FUNC() can be used to specify a function that can be called to retrieve the latest counter value. The developer is responsible for implementing this function. This function will be called each time Performance Monitor asks for the latest counter values.
There are obviously several other macros that could be written to specify counters. These macros could include support for other data types and different methods of accessing counter data.
Instances of IPerfmonCounterImpl are constructed by the application's instance of IPerfmonObjectImpl. These instances are released by the ExtCounters Performance DLL. When ExtCounters calls IPerfmonObject::GetCounters, the instance of IPerfmonObjectImpl uses the information in the counter map to properly construct the appropriate number of instances of IPerfmonCounterImpl.
IPerfmonCounterImpl shouldn't have to be derived from if the developer uses the default implementation provided by IPerfmonObjectImpl. However, BEGIN_COUNTER_MAP() is parameterized to allow flexibility in situations where developers want to use an implementation of IPerfmonCounter other than the one provided by IPerfmonCounterImpl.
The registration component (RegPerfCounters) is used to write all the data to the registry that is needed for an application to support custom performance counters. This data includes the application's Performance key and the object and counter values typically done using the lodctr utility.
Registration is done using a COM interface called IRegisterPerfmonObject that is exposed by the RegPerfCounters component. This interface is described below. Because registration is done through a COM interface, the registration component can be called from any language, including Visual Basic.
As mentioned previously, each application supplies one component that exposes the IPerfmonObject interface. RegPerfCounters uses this collection component to collect the data needed during registration.
RegPerfCounters creates an instance of the application's collection component and calls the GetName and GetHelp members of IPerfmonObject and IPerfmonCounter when adding the counter data to the registry.
Typically the calls to the registration component are made either during application startup or when the application is performing self-registration. A typical COM server will register its components when the application is started with the –RegServer parameter. This is an excellent opportunity to register the performance monitor counter information as well. Another common scenario is to register the counter information from the application's setup program.
The definition of IRegisterPerfmonObject is:
interface IRegisterPerfmonObject : IDispatch
{
   HRESULT Register([in]BSTR appName, [in]BSTR collectionGUID);
   HRESULT Unregister([in]BSTR appName);
};
Figure 11.
This method registers all data needed to support custom performance monitor counters. As mentioned previously, this method creates an instance of the application's collection component to gather the data needed during registration. The parameter "collectionGUID" provides the CLSID of the application's collection component.
This method removes the application's Performance Monitor object and counter values.
We have provided two C++ utility functions to make it easier to call the registration component. These functions hide of details of creating and calling the RegPerfCounters COM component. These functions are:
bool RegisterPerformanceCounters(LPCTSTR pAppName, CLSID collectionGUID);
bool UnRegisterPerformanceCounters(LPCTSTR pAppName);
Figure 12.
As their names suggest, the first function is used to register the counters and the second function is used to remove them from the registry.
The ExtCounters DLL is a generic Performance DLL that can be used by any application. ExtCounters collects performance data from the application's collection component and formats it for use by Performance Monitor. ExtCounters implements the details of interacting with Performance Monitor so the application's collection component can focus on collecting performance data.
ExtCounters uses COM to communicate with the application being monitored. The use of COM as a communication mechanism has two advantages. First, it allows interfaces to be defined independent of the applications being monitored. Second, it facilitates performance monitoring with applications written in any language that supports the creation of COM components.
The ExtCounters DLL identifies an application's collection component through registry settings. When Performance Monitor calls the DLLs Open function, it passes the value of the Export value under the application's Linkage key. For the application MyServer, this key would be HKEY_LOCAL_MACHINE\SYSTEM\CurrentControlSet\Services\MyServer\Linkage. The Export value is set to the application name during registration by the RegPerfCounters utility. Given the application name, ExtCounters reads the value of the CollectionComponent value under the application's Performance key to find the CLSID of the collection component. Figure 13 shows a Performance key with the CollectionComponent value.
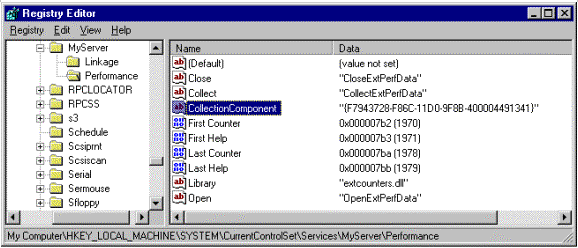
Figure 13.
In the Open function, ExtCounters uses this CLSID to create an instance of the collection component and obtain its IPerfmonObject and IPerfmonCounter interfaces. These interfaces are used to gather information about the application's counters and build the appropriate Performance Monitor data structures. In addition, when Performance Monitor calls the Collect function in ExtCounters, the DLL calls IPerfmonCounter::Collect on each counter to retrieve the latest counter data. In addition to the CollectionComponent values, several other values under the application's Performance key are used during the collection process (see Figure 13). These include:
Close
This registry value is the name of the Performance DLL's Close function. For ExtCounters, this is always CloseExtPerfData.
Collect
The Collect value holds the name of the Performance DLL's Collect function. For ExtCounters, this is always CollectExtPerfData.
First Counter, First Help, Last Counter, Last Help
These values contain offset information used by Performance Monitor. Indexes must be assigned for each application that provides custom objects and counters. An application assigns these starting at 0. These registry values represent the offset of a particular application's counters in Performance Monitors master list of counters. These values are written by the registration component described above. The registration component uses the lodctr utility to write these values.
Library
The Library value contains the name of the application's Performance DLL. When adding custom counters as described in this paper, this value will always be ExtCounters. Note that the Performance DLL must be in the path.
Open
This registry value is the name of the Performance DLL's Open function. For ExtCounters, this is always OpenExtPerfData.
This section uses an example to illustrate how to implement performance counters in an application. Our sample application is a COM server called the Financial Server. The Financial Server allows users to connect to it and perform various financial calculations. The Financial Server is accessed via DCOM from a Visual Basic client and uses SQL Server as a data store. The COM components are built using ATL and data access is done through ODBC. The high-level architecture is shown in Figure 14.
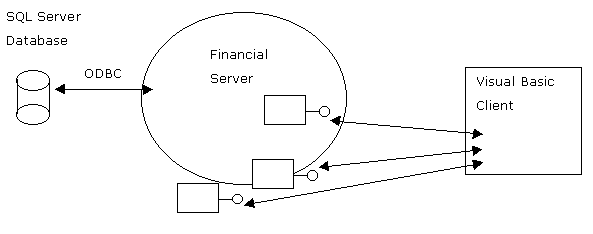
Figure 14.
The first step in adding counters to an application is to determine what to measure. The Financial Server application includes counters that can be used for both tuning and debugging the application. The custom counters in the Financial Server are:
Active Users. This counter tracks the number of users that are currently connected to the Financial Server.
ODBC Connections. This counter tracks the number of open ODBC connections in the server.
Module Locks. Because the Financial Server contains COM components, tracking the number of outstanding locks on the server can help debug reference counting problems.
Queued Events. The Financial Server uses COM's connection point interfaces to send events to the Visual Basic clients. These events are queued in the server and sent in the order they are placed on the queue. The Queued Events counter tracks the number of events in the queue.
After the counters have been defined, code must be added to the application to expose the IPerfmonObject and IPerfmonCounter interfaces. First, the IDL source for IPerfmonObject and IPerfmonCounter must be included in the project's IDL file. Second, the IPerfmonObjectImpl and IPerfmonCounterImpl classes can be used to provide implementations of the required interfaces.
We have provided an IDL source file (PerfCounters.idl) that includes the definitions of IPerfmonObject and IPerfmonCounter. This file must be included in the project's IDL file as shown in Figure 15.
//
// Application's interfaces described here
//
…
…
#include "PerfCounters.idl"
//
// The rest of the application's idl source defined below
//
[
   uuid(DA321ED4-79EA-11D0-8A16-400004491007),
   version(1.0),
   helpstring("FinServ 1.0 Type Library")
]
library FINSERVLib
{
…
…
};
Figure 15.
Each application that supports custom counters must provide one COM component that implements the IPerfmonObject interface. This component is used during both the data collection process and the registration process. As described above, the class IPerfmonObjectImpl makes it easy to write a component that exposes IPerfmonObject. To use IPerfmonObjectImpl, a developer derives from the class and provides a counter map. See the earlier section on C++ support for a detailed description of IPerfmonObjectImpl. Figure 16 below shows how IPerfmonObjectImpl is used in the Financial Server.
class ATL_NO_VTABLE CFinServCounters :
   public CComObjectRootEx<CComMultiThreadModel>,
   public CComCoClass< CFinServCounters, &CLSID_CFinServCounters>,
   public ISupportErrorInfo,
   public IPerfmonObjectImpl<&LIBID_FinServLib>
{
public:
   CFinServCounters () { }
   virtual ~ CFinServCounters () {}
DECLARE_REGISTRY_RESOURCEID(IDR_FINSERVCOUNTERS)
BEGIN_COM_MAP(CFinServCounters)
   COM_INTERFACE_ENTRY(IPerfmonObject)
   COM_INTERFACE_ENTRY(IDispatch)
   COM_INTERFACE_ENTRY(ISupportErrorInfo)
END_COM_MAP()
BEGIN_COUNTER_MAP(IPerfmonCounterImpl)
   COUNTER_ENTRY_LONG("Active Users Users",
                               "The number of users connected to the Financial Server",
                                &CFinServCounters::m_numUsers)
   COUNTER_ENTRY_LONG_FUNC("ODBC Connections",
              "The number of ODBC connections the Financial Server has open",
               CFinServCounters::GetOpenDBConnections)
   COUNTER_ENTRY_LONG_FUNC("Module Locks",
              "The number of outstanding reference counts held on the Financial Server ",
               CFinServCounters::GetModuleLocks)
   COUNTER_ENTRY_LONG("Queued Events",
                           "The number of events waiting to be send fromthe Financial Server",
                                 &CFinServCounters::m_queuedEvents)
END_COUNTER_MAP()
// ISupportsErrorInfo
   STDMETHOD(InterfaceSupportsErrorInfo)(REFIID riid);
static long m_numUsers;
static long m_queuedEvents;
static void GetOpenDBConnections(long& numDBConnections);
static void GetModuleLocks(long& numLocks);
};
Figure 16.
Both the Performance DLL (ExtCounters) and the Registration DLL (RegPerfCounters) communicate with the application through COM interfaces derived from IDispatch. As a result, the components that implement IPerfmonObject and IPerfmonCounter can be written in a variety of languages including Visual Basic. Figure 17 shows a class that implements IPerfmonCounter in Visual Basic.
Implements IPerfmonCounter
Dim m_numUsers As Long
Public Sub Class_IncrementNumUsers()
  m_numUsers = m_numUsers + 1
End Sub
Public Sub Class_DecrementNumUsers()
  m_numUsers = m_numUsers - 1
End Sub
Private Function IPerfmonCounter _Collect() As Variant
 CFinServPerfmonCounter _Collect = m_numUsers
End Function
Private Function IPerfmonCounter _GetDataType() As Integer
 CFinServPerfmonCounter _GetDataType = vbLong
End Function
Private Function IPerfmonCounter _GetHelp() As String
 CFinServPerfmonCounter _GetHelp = "The number of users connected to the Financial Server"
End Function
Private Function IPerfmonCounter _GetIndex() As Long
 CFinServPerfmonCounter _GetIndex = 2
End Function
Private Function IPerfmonCounter _GetName() As String
 CFinServPerfmonCounter _GetName = "Active Users"
End Function
Figure 17.
As described earlier, the registration component (RegPerfCounters) is used to write all the data to the registry that is needed for an application to support custom performance counters. Registration is done using a COM interface called IRegisterPerfmonObject that is exposed by the RegPerfCounters component.
We have provided two C++ utility functions to simplify the process of calling the RegPerfCounters component.
Registration can be done in a number of places in an application. The most common are:
The Financial Server calls RegPerfCounters while performing other registration tasks including registering COM components. Registration occurs when the Financial Server executable is started with the /RegServer command line argument. The following example demonstrates the use of the C++ utilities to perform registration in the Financial Server in an ATL-generated WinMain routine.
extern "C" int WINAPI _tWinMain(HINSTANCE hInstance,
   HINSTANCE /*hPrevInstance*/, LPTSTR lpCmdLine, int /*nShowCmd*/)
{
…
…
 bool bSuccess = false;
 LPCTSTR lpszToken = FindOneOf(lpCmdLine, szTokens);
 while (lpszToken != NULL)
 {
  if (lstrcmpi(lpszToken, _T("RegServer"))==0)
  {
   _Module.UpdateRegistryFromResource(IDR_FinancialServer, TRUE);
    bSuccess = SUCCEEDED( _Module.RegisterServer(TRUE)) &&
                  RegisterPerformanceCounters("FinancialServer", CLSID_CFinServCounters);
    break;
  }
  if (lstrcmpi(lpszToken, _T("UnregServer"))==0)
  {
    _Module.UpdateRegistryFromResource(IDR_FinancialServer, FALSE);
    bSuccess = SUCCEEDED(_Module.UnregisterServer()) &&
UnRegisterPerformanceCounters("FinancialServer");
    break;
  }
  lpszToken = FindOneOf(lpszToken, szTokens);
}
…
…
Figure 18.
As described above, registration is done through a COM interface based on IDispatch (IRegisterPerfmonObject). As a result, performance monitor counter registration can be done from any language that supports calling COM components. The following example shows Visual Basic code that registers counter information during application startup. In Visual Basic, the type library from the RegPerfmonCounters DLL must be referenced in the project through the Project->References dialog box before the registration component can be used.
Private Sub Form_Load()
Dim regPerfCounters As New RegisterPerfmonObject
' Register the application's counters. The first parameter
' is the application name and the second parameter is the
' clsid of the component that implements IPerfmonObject
regPerfCounters.Register "MyServer", "DA321ED6-79EA-11D0-8A16-400004491007"

End Sub
Figure 19.
The final step in adding custom counters is to make the ExtCounters DLL visible to Performance Monitor.
Performance Monitor locates this by looking at the Library value in the application's Performance key. This information is added during the registration process. In order for Performance Monitor to find ExtCounters.dll it must be copied to a directory that is in the path. A common place to put ExtCounters.dll is in the System32 folder under your NT directory.
Now that the collection component has been implemented, registration has been done, and ExtCounters is visible to Performance Monitor, the application's custom counters are ready to use. The counters will appear in the "Add To Chart" dialog (see Figure 8) in Performance Monitor and will show up on the charts when added.
Performance Monitor has several other features that a Performance DLL can support. These features include the support for multiple objects in an application, multiple instances per object, and various data and counter types. These features can be implemented generically in the ExtCounters DLL in the same way the features described in this paper have been.
Using Performance Monitor to tune and debug an application helps to produce a better quality application and to lower its TCO over time. An application takes advantage of Performance Monitor by supplying application-specific objects and counters that are displayed by Performance Monitor in the same way system provided objects are. Several steps and components are needed to implement custom counters using the native Performance Monitor interface. This paper describes a set of COM interfaces, C++ classes and generic components that make the process of adding custom counters much easier. Because the interface to Performance Monitor is described in terms of COM objects, the custom performance counters can be written in any language that supports the development of COM components.