When you notice that you have a performance problem, your first step should be to run Performance Monitor. This tool is available in the Windows NT Administrative Tools program group.
It is not the objective of Performance Monitor to solve all performance problems, but rather to identify the areas in which performance problems exist. Isolating the problem is a good first step. The Platform SDK provides several tools you can use to tune your application, so running Performance Monitor before tuning helps to ensure that you use the right tools to isolate the problem.
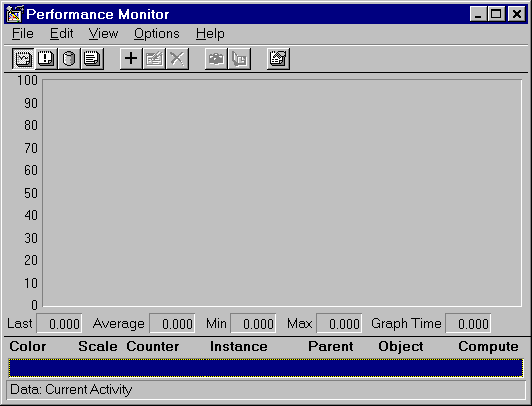
The performance data is charted in the following window.

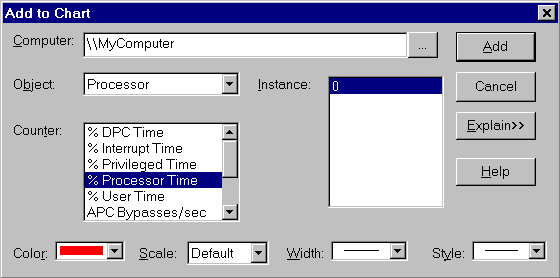
Choose the performance counters to monitor by going to the Edit menu and clicking Add To Chart. The following dialog box appears.

When you select an Object, the corresponding counters are displayed. Select a counter and click Add to begin monitoring the counter.