(controlled by MRANGE=, MAXPAGE=, NAMLMP=, PSORT=, T1I#=, LINELENGTH=)
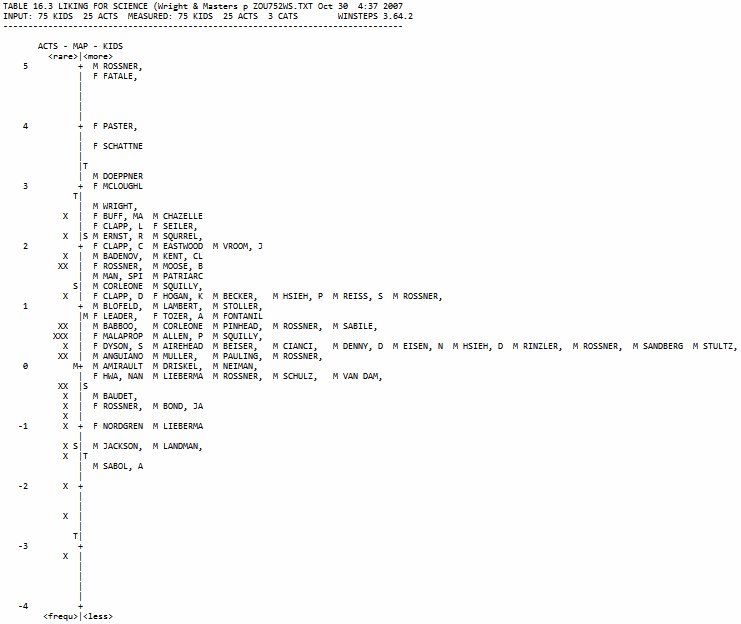
In Table 16.3, the full person names are shown with an item distribution. You can use NAMLMP= or PMAP=to control the number of characters of each name reported. "TSMST" summarize the distributions. An "M" marker represents the location of the mean measure. "S" markers are placed one sample standard deviation away from the mean. "T" markers are placed two sample standard deviations away. MAXPAGE= controls the length of the Table. MRANGE= controls the displayed range of measures. PSORT= controls the sort order within rows.
Where there are more persons than can be shown on one line, the persons are printed on subsequent lines, but the latent variable "|" does not advance and is left blank.
T1I#= sets the number of items for each "#"
Persons arranged by measure: Look for the hierarchy of person names to spell out a meaningful distribution from highest scoring at the top to lowest scoring at the bottom.

With PMAP=1 and T1P#=2 -
ACTS - MAP - KIDS
<rare>|<more>
3 +
|
| M
| F
|T F
| F
| M
2 T+ F
. | F M M
. | F F
|S M M
. | F M M
# | F M M M
| M M
1 S+ F F M M M
. | M M M
|M F F M M M M
. | M M
. | F M M M M M
.# | M M M M M
. | F M M M M M M M M M
0 # M+ M M M
|S F M M M M
. |
# | M
. | F M
. | M
. | F
-1 . S+ M M
. |T
| M
. |
. |
. |
|
-2 T+
<frequ>|<less>
EACH "#" IS 2. EACH "." IS 1.