(controlled by Distractors=Y, OSORT=, CFILE=, PTBIS=)
ITEM OPTION FREQUENCIES are output if Distractors=Y. These show occurrences of each of the valid data codes in CODES=, and also of MISSCORE= in the input data file. Counts of responses forming part of extreme scores are included. Only items included in the corresponding main table are listed. These statistics are also in DISFILE=, which includes entries even if the code is not observed for the item.
OSORT= controls the ordering of options within items. The standard is the order of data codes in CODES=.
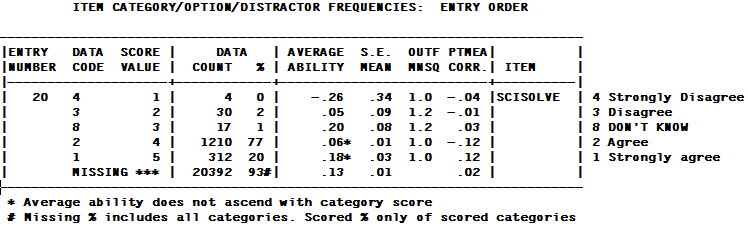
ENTRY NUMBER is the item sequence number.
The letter next to the sequence number is used on the fit plots.
DATA CODE is the response code in the data file.
MISSING means that the data code is not listed in the CODES= specification.
Codes with no observations are not listed.
SCORE VALUE is the value assigned to the data code by means of NEWSCORE=, KEY1=, IVALUEA=, etc.
*** means the data code is ignored, i.e., regarded as not administered. MISSCORE=1 scores missing data as "1".
DATA COUNT is the frequency of the data code in the data file - this includes observations for both non-extreme and extreme persons and items. For counts only for non-extreme persons and items, see the DISFILE=
DATA % is the percent of scored data codes. For dichotomies, the % are the proportion-correct-values for the options.
For data with score value "***", the percent is of all data codes, indicated by "#".
AVERAGE ABILITY is the observed, sample-dependent, average measure of persons (relative to each item) in this analysis who responded in this category (adjusted by PWEIGHT=). This is equivalent to a "Mean Criterion Score" (MCS) expressed as a measure. It is a sample-dependent quality-control statistic for this analysis. (It is not the sample-independent value of the category, which is obtained by adding the item measure to the "score at category", in Table 3.2 or higher, for the rating (or partial credit) scale corresponding to this item.) For each observation in category k, there is a person of measure Bn and an item of measure Di. Then: average measure = sum( Bn - Di ) / count of observations in category.
An "*" indicates that the average measure for a higher score value is lower than for a lower score value. This contradicts the hypothesis that "higher score value implies higher measure, and vice-versa".
The "average ability" for missing data is the average measure of all the persons for whom there is no response to this item. This can be useful. For instance, we may expect the "missing" people to be high or low performers, or to be missing random (and so they average measure would be close to the average of the sample).
These values are plotted in Table 2.6.
S.E. MEAN is the standard error of the mean (average) measure of the sample of persons who responded in this category (adjusted by PWEIGHT=).
OUTFIT MEAN-SQUARE is the ratio of observed variance to expected variance for observed responses in this category. Values greater than 1.0 indicate unmodeled noise. Values less than 1.0 indicate loss of information.
Why no INFIT MEAN-SQUARE? This subtable stratifies fit by response category. INFIT is uninformative in this context, because each fit statistic is reporting only the observations reported in the category. INFIT would be useful if the subtable also reported for each category the fit of the observations that aren't in the category, but, according to the model, should be.
PTMEA CORR is the correlation between the data code, scored 1, or non-occurrence, scored 0, of this category or distractor and the person raw scores or measures. Each response code (scored or "missing") is correlated only with scored response codes. With PTBISERIAL=Yes or All, the correlation is between the occurrence and the person raw score, indicated by PTBSD CORR. When this correlation is high positive for a correct MCQ option, then the item exhibits convergent validity. When this correlation is low or negative for incorrect MCQ options, then the item exhibits discriminant validity. Krus, D. J. & Ney, R. G. (1978) Convergent and discriminant validity in item analysis. Educational and Psychological Measurement, 38, 135-137.
Each scored response code is correlated only with the other scored codes: "1" for target code "0" for other scored codes. . Missing responses are correlated with all responses.
PTBSA CORR is PTBIS = All (include the current item in the person score)
PTBSE CORR is PTBIS = Yes (exclude the current item in the person score)
PTMEA CORR is PTBIS = No (correlate with the person measure)
The "Missing" point-measure correlation is the correlation between the raw scores for the persons and the responses to the item with "missing" scored 1 and the other responses scored 0.
The category (or option) correlation is always computed the same way:
1. We focus on a particular response to a particular item.
2. Everyone who chose that response to the item is scored "1", everyone else is scored "0". Missing data are ignored.
3. The scores of "1" or "0" are correlated with the person measures.
4. We do this for every response to every item.
ITEM (here, ACT) is the name or label of the item.
Data codes and Category labels are shown to the right of the box, if CLFILE= or CFILE= is specified.
Multiple-Choice (MCQ) Distractors
The distractor table reports what happened to the original observations after they were scored dichotomously.
Item writers often intend the MCQ options to be something like:
A. Correct option (scored 1) - high-ability respondents - highest positive point-biserial
B. Almost correct distractor (scored 0) - almost-competent respondents - somewhat positive point-biserial
C. Mostly wrong distractor (scored 0) - slightly competent respondents - zero to negative point-biserial
D. Completely wrong distractor (scored 0) - ignorant respondents - highly negative point-biserial
The distractor table reports whether this happened.
You will obtain exactly the same Rasch measures if you score your MCQ items in advance and submit a 0-1 dataset to Winsteps.
Example:
ni=4
codes=01
name1=1
item1=1
codes = 01A
ptbis=YES
misscore=1
&end
END LABELS
0110
1001
A001 ; A is in Codes= but scored "missing"
B101 ; B is not in Codes= but is scored 1 by MISSCORE=1
---------------------------------------------------------------------
|ENTRY DATA SCORE | DATA | AVERAGE S.E. OUTF PTBSE| |
|NUMBER CODE VALUE | COUNT % | MEASURE MEAN MNSQ CORR.| ITEM | Correlation:
|--------------------+------------+--------------------------+------| Code with Score
| 1 A *** | 1 25*| -.70 -.50 |I0001 | A {0,0,1,-}{2,1,1,2}
| 0 0 | 1 33 | -.01 .7 1.00 | | 0 {1,0,-,-}{2,1,1,2}
| 1 1 | 1 33 | -.01* 1.4 -1.00 | | 1 {0,1,-,-}{2.1,1,2}
| MISSING 1 | 1 33 | 1.26 .4 .50 | | B {0,0,-,1}{2,1,1,2}