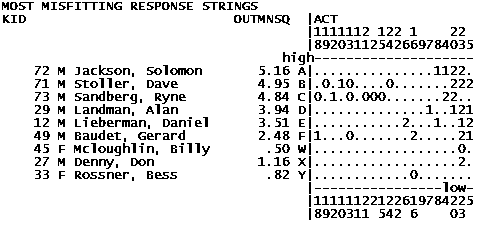
Table 6.4 displays the unexpected responses in the most-misfitting person-response strings.
In this Table, the persons (rows) are sorted:
OUTFIT=Yes |
Sorted by Outfit Mean-square descending |
OUTFIT=No |
Sorted by bigger of Outfit Mean-square and Infit mean-square descending. |
The items (columns) are sorted by measure. The easiest item (highest-scoring) is on the left. The item entry-numbers are in each column (vertically). In the Figure, the first is item 18. The items shown are those with the most-unexpected responses. UCOUNT= sets the maximum number of items to report. LINELENGTH= controls the width of the table.
Each row contains:
Person entry number
Person label
Person outfit mean-square
Person letter (A-Z) in the plot in Tables 4 and 5.
The responses to the items:
0, 1, 2 and numeric values |
Scored unexpected-responses |
. |
Expected responses, standardized residuals < |2| |
(blank) |
Missing data |
The 26 persons at the top of Table 6.1 are shown, excluding those with no unexpected responses on the displayeditems.