Previous Next


Inventory > Sales > Sales Reports


Sales Reports
This section includes samples and descriptions of Sales-related reports available in MenuLink Client. Depending on your system set-up, you may not have access to all reports and selection options described. Contact your system administrator for more information.
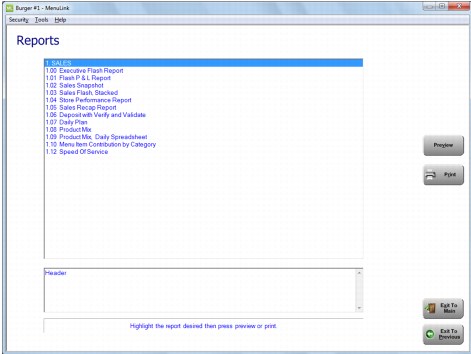
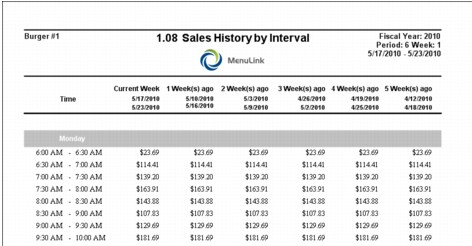
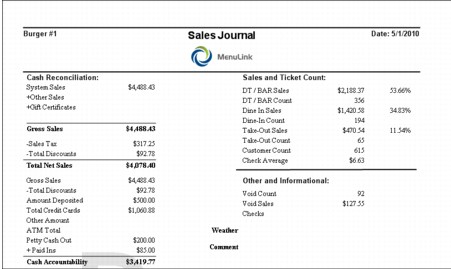
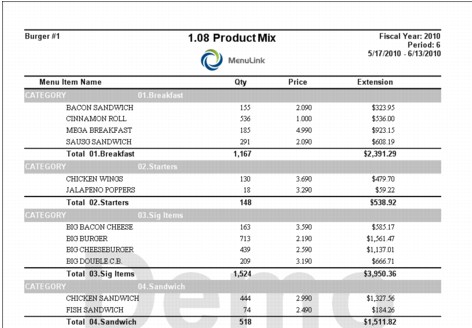
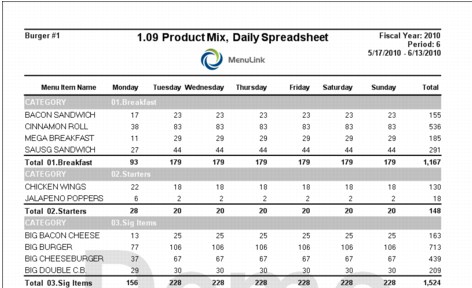
For general information on how to view and print reports, as well as selecting report options, see Viewing and Printing Reports.
You can access Sales reports from the Reports button on the Sales Switchboard (Sales reports only, as shown in the screen example below) or from the Reports button on the Main Switchboard (all Inventory reports).
 

Forecast Sales and Guests Report
The Forecast Sales and Guests report forecasts sales and guest information based on prior sales (up to 6 weeks prior to the current date, or from the previous year).
CL_SalesRpts_410ForecastSalesGuests
Menu Item Contribution by Category Report
The Menu Item Contribution by Category report lists each menu item, its current food cost, and its contribution based on sales. Ideal contribution is the gross profit derived from the sale of this item. (Margin multiplied by the number sold)
CL_SalesRpts_110MenuItmContribCat
CL_SalesRpts_110MenuItmContribCatP2
Menu Item Contribution Stacked Report
The Menu Item Contribution Stacked report is similar to the Menu Item Contribution by Category report, except that multiple sites can be compared.
CL_SalesRpts_111MenuItmContStacked
CL_SalesRpts_111MenuItmContStackedP2
Menu Item Contribution by Item Stacked- Report
The Menu Item Contribution by Item Stacked report uses FIFO calculations for theoretical cost. This report supports sortable columns. The Menu Items is linked to the Sales Mix Percentage report. By clicking on a Menu Item, underlined in blue, the Sales Mix Percentage report will display more detail sales information for the selected Menu Item.
 
Sales and Guests by Interval Report
The Sales and Guests by Interval Report shows the sales and number of guests broken down for all daily intervals. The report also includes guest check averages for each day.
Depending on reports configured for your MenuLink Client system, you may also have additional reports for specific dining destinations (e.g., Sales and Guest by Interval – To Go).
CL_SalesRpts_SalesGuestInterval
Sales Deposit Report
The Sales Deposit report shows sales deposit amounts, dates, the name of the person who made and/or modified the deposit, and the bag number.
CL_SalesRpts_116SalesDeposits
Sales History by Interval Report
The Sales History by Interval report shows current and historical sales by interval, based on the time period selected when generating the report.
CL_SalesRpts_108SalesHistIntvl
Sales Journal Report
The Sales Journal report shows sales and financial information for the selected time frame (for example, days, weeks, period). This report can also be printed from the Cash Reconciliation screen.
CL_SalesRpts_SalesJournal
Product Mix Report
The Product Mix report shows menu item sales mix information (quantity, price, and extension), grouped by category for the selected time frame.
CL_SalesRpts_108ProductMix
Product Mix, Daily Spreadsheet
The Product Mix, Daily Spreadsheet report shows the number of menu items sold for each day of the week during the selected time frame.

CL_SalesRpts_109ProdMixDailySpread
Sales Mix Forecast Report
The Sales Mix Forecast report shows the forecasted sales mix, sorted by category, for a selected time frame.
CL_SalesRpts_SalesMixForecast
Sales Mix Percentage Report
The Sales Mix Percentage report lists all items sold, sorted by category, and displays the relative percentage of unit sales for each item in each category.
CL_SalesRpts_113SalesMix_Percentage
Sales Mix Without Recipes Report
The Sales Mix Without Recipes report shows all items that were sold but have no recipes. Sales of items that do not have recipes can adversely impact theoretical food cost figures.

CL_SalesRpts_SalesMix_NoRecipes
Sales Summary Report
The Sales Summary report is a snapshot of the net sales, labor costs, and cash over/short for a selected time frame.
CL_SalesRpts_SalesSummaryReport
Theoretical Use Based on Sales Report
The Theoretical Use Based on Sales report is a list of inventory items that should have been used based on sales for a selected time frame.
CL_SalesRpts_506TheoUseBasedSales
Theoretical Use of Raw Materials Report
The Theoretical Use of Raw Materials report lists each raw item used, the items that the raw items were used in, the amount used in the recipe, and the total use for a selected time frame. Totals are given for each category.

CL_SalesRpts_507TheoUseRawMatls
Unknown Codes from POS System Report
The Unknown Codes from POS System report lists all unknown PLU codes entered in the POS that do not have a matching code in MenuLink Client over a selected time frame. The report lists the date the code was entered on the POS, the unknown PLU code, item name, and price.
CL_SalesRpts_UnknownCodes
Tip Share Distribution Report
The Tip Share Distribution report displays each of the employees with eligible job codes and their tip share dollars. This report also has a place for the employee and the manager signature for tracking who from each shift has picked up the tip share.
CL_SalesRpts_TipShareDist
 

MenuLink Online Help
Copyright © 2012 Radiant Systems, Inc. All rights reserved.