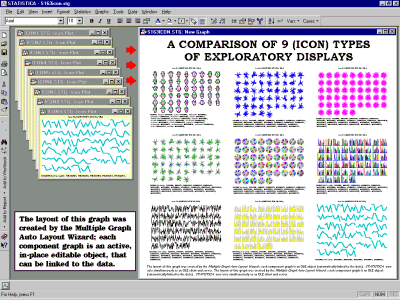
In addition to the compound graphs created by STATISTICA, STATISTICA offers several methods to create custom compound graphs. The simplest method is by copying and pasting graphs manually and arranging them interactively on-screen. STATISTICA Visual Basic can also be used to create highly customized compound graphs. In addition, STATISTICA provides two wizard-based methods for creating user-defined compound or multiple graphs.

To access these methods select Multiple
Graph Layouts from the Graphs
menu or click the STATISTICA
Start ![]() button on
the STATISTICA Analysis
bar and select Graphs - Multiple Graph
Layouts.
button on
the STATISTICA Analysis
bar and select Graphs - Multiple Graph
Layouts.