For this example, open the Factor.sta
data file located in the Examples\Datasets
folder of your STATISTICA installation
folder. You can open it using the File
- Open Examples
menu (it is in the Datasets folder),
the Open Data button on any Startup
Panel, or the ![]() toolbar
button. Factor.sta contains the
(hypothetical) results of a questionnaire used to measure people's satisfaction
with their lives. The questionnaire asked subjects questions about their
work, home, hobbies, and other areas of their lives. For a detailed discussion
of the characteristics of Graphs of
Block Data, see the Graphs
of Block Data overview topic.
toolbar
button. Factor.sta contains the
(hypothetical) results of a questionnaire used to measure people's satisfaction
with their lives. The questionnaire asked subjects questions about their
work, home, hobbies, and other areas of their lives. For a detailed discussion
of the characteristics of Graphs of
Block Data, see the Graphs
of Block Data overview topic.
Producing the Graph
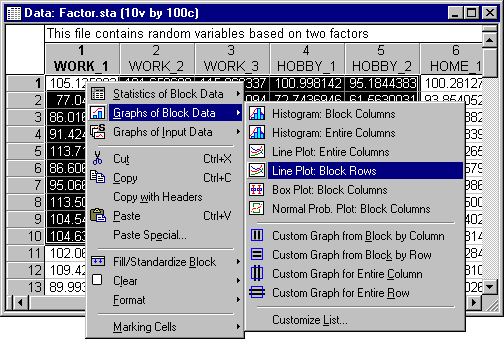
After opening Factor.sta, select a block of data that includes the first five columns (Work_1, Work_2, Work_3, Hobby_1, and Hobby_2) and the first ten rows (cases 1-10).
Right-click in the selected block, and select Graphs of Block Data - Line Plot: Block Rows from the shortcut menu.
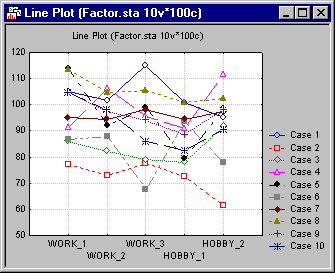
This selection produces a line plot of cases for the first ten rows in the datafile allowing you to compare the responses of the first ten respondents on five of the questions.
To create a line plot by rows for all rows (not just the selected rows), use the Graphs of Block Data - Custom Graph for Entire Column command to display the Select Graph dialog, and then select 2D Graphs in the Select Graph Category box and Line Plots (Case Profiles) in the Select Graph Type box.