Suppose you have created a graphics style by specifying various non-default point markers for scatterplots. You have used Save As to save the style under the name MyScatterplotStyle. There are various ways to retrieve the style and apply it to selected newly created scatterplots.
Selecting the style on the Appearance tab. Begin by selecting Scatterplots from the Graphs menu to display the 2D Scatterplots dialog. Select the variables for the plot, etc., and then click on the Appearance tab. The newly created style can be selected in the Graph style box of this tab.
Selecting the style from the Graphics Style box of the Graph Tools toolbar. You can also apply the newly created style after one or more graphs have been created. When the currently active window is a graph, then by default (unless you disabled that toolbar) the Graph Tools toolbar will be displayed. This toolbar contains a drop-down box with all graphics styles.
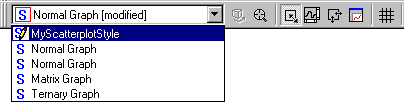
Select MyScatterplotStyle to apply all specifications in that style to the current (existing) graph(s).
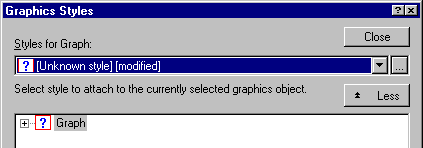
Selecting the style from the Graphics Styles dialog. You can also double-click anywhere on the graph background to display the Graph Options dialog. In the lower-left corner is the Styles button. Click the Styles button to display the Graphics Styles dialog. Then click the More button to see all properties and attributes of the current style. Finally, collapse the root Graph directory of the tree browser, as shown below.
Now, click the Styles for Graph drop-down box to see all currently available styles.
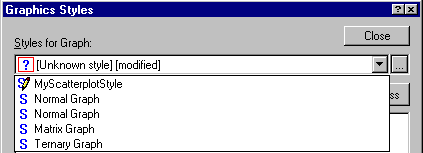
Select MyScatterplotStyle to apply all specifications in that style to the current (existing) graph.
Previously saved graphs. Note that by default, previously saved graphs do not automatically update to match the styles when they are opened. However, if you select Automatically Update Style from the View menu and save the graph, then it will update when opened.
See also, Importing and Exporting Styles.