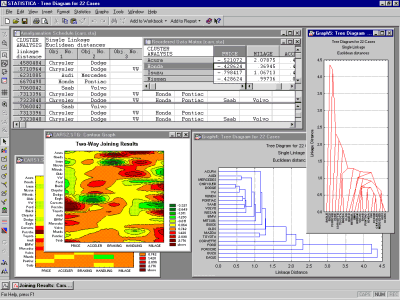
In addition to the standard selection of Graphs of Input Data, Graphs of Block Data, and Graphs menu graphs, other specialized statistical graphs that are related to a type of analysis (e.g., cluster analysis results) are accessible directly from results dialogs (i.e., the dialogs that contain output options from the current analysis).

The specialized graphs are described in the context of the respective analyses from which they can be produced; thus, for specific information refer to the respective sections of the Electronic Manual).