Question: To calibrate item difficulty, I am using data from 75 subjects. Most of the subjects have been tested repeatedly, between two and 9 times each. The reason for this was that I assumed that by training and time (with natural development) the subjects ability was different between different testing situations. Now the referee has asked me to verify that "the requirement of local independence is not breached". How can I check this?
Unidimensionality can be violated in many different ways. If you run all known statistical tests to check for violations (even with your subjects tested only once), your data would undoubtedly fail some of them - (for technical details of some of these tests see Fischer & Molenaar, "Rasch Models", chapter 5.) Consequently, the question is not "are my data perfectly unidimensional" - because they aren't. The question becomes "Is the lack of unidimensionality in my data sufficiently large to threaten the validity of my results?"
Pre-Test - Post-Test dependency (or any two tests with the same persons)
1. Stack the data: all pre-test data records. Below them, all post-test data records, in the same sequence.
2. Rasch-analyze these data.
3. Output the IPMATRIX= of standardized residuals to Excel
4. For each item, correlate the pre-test standardized residuals with the post-test standardized residuals.
5. Noticeable positive correlations indicate dependency for those items between pre-test and post-test.
Imagine that you accidentally entered all your data twice. Then you know there is a lack of local independence. What would happen? Here is what happened when I did this with the dataset exam12lo.txt:
Data in once:
SUMMARY OF 35 MEASURED PERSONS
+-----------------------------------------------------------------------------+
| RAW MODEL INFIT OUTFIT |
| SCORE COUNT MEASURE ERROR MNSQ ZSTD MNSQ ZSTD |
|-----------------------------------------------------------------------------|
| MEAN 38.2 13.0 -.18 .32 1.01 -.1 1.02 .0 |
| S.D. 10.1 .0 .99 .06 .56 1.4 .57 1.3 |
| MAX. 54.0 13.0 1.44 .59 2.36 2.9 2.28 2.5 |
| MIN. 16.0 13.0 -2.92 .29 .23 -2.9 .24 -2.3 |
|-----------------------------------------------------------------------------|
| REAL RMSE .36 TRUE SD .92 SEPARATION 2.55 PERSON RELIABILITY .87 |
|MODEL RMSE .33 TRUE SD .94 SEPARATION 2.85 PERSON RELIABILITY .89 |
| S.E. OF PERSON MEAN = .17 |
+-----------------------------------------------------------------------------+
PERSON RAW SCORE-TO-MEASURE CORRELATION = .99
CRONBACH ALPHA (KR-20) PERSON RAW SCORE RELIABILITY = .89
SUMMARY OF 13 MEASURED ITEMS
+-----------------------------------------------------------------------------+
| RAW MODEL INFIT OUTFIT |
| SCORE COUNT MEASURE ERROR MNSQ ZSTD MNSQ ZSTD |
|-----------------------------------------------------------------------------|
| MEAN 102.9 35.0 .00 .20 1.08 -.2 1.02 -.2 |
| S.D. 23.6 .0 .93 .03 .58 2.3 .53 2.0 |
| MAX. 145.0 35.0 2.45 .31 2.16 3.9 2.42 4.3 |
| MIN. 46.0 35.0 -1.65 .18 .31 -4.2 .39 -3.3 |
|-----------------------------------------------------------------------------|
| REAL RMSE .24 TRUE SD .90 SEPARATION 3.81 ITEM RELIABILITY .94 |
|MODEL RMSE .20 TRUE SD .91 SEPARATION 4.53 ITEM RELIABILITY .95 |
| S.E. OF ITEM MEAN = .27 |
+-----------------------------------------------------------------------------+
Data in twice:
SUMMARY OF 70 MEASURED PERSONS
+-----------------------------------------------------------------------------+
| RAW MODEL INFIT OUTFIT |
| SCORE COUNT MEASURE ERROR MNSQ ZSTD MNSQ ZSTD |
|-----------------------------------------------------------------------------|
| MEAN 38.2 13.0 -.18 .32 1.01 -.1 1.02 .0 |
| S.D. 10.1 .0 .99 .06 .56 1.4 .57 1.3 |
| MAX. 54.0 13.0 1.44 .59 2.36 2.9 2.28 2.5 |
| MIN. 16.0 13.0 -2.92 .29 .23 -2.9 .24 -2.3 |
|-----------------------------------------------------------------------------|
| REAL RMSE .36 TRUE SD .92 SEPARATION 2.55 PERSON RELIABILITY .87 |
|MODEL RMSE .33 TRUE SD .94 SEPARATION 2.85 PERSON RELIABILITY .89 |
| S.E. OF PERSON MEAN = .12 |
+-----------------------------------------------------------------------------+
PERSON RAW SCORE-TO-MEASURE CORRELATION = .99
CRONBACH ALPHA (KR-20) PERSON RAW SCORE RELIABILITY = .89
SUMMARY OF 13 MEASURED ITEMS
+-----------------------------------------------------------------------------+
| RAW MODEL INFIT OUTFIT |
| SCORE COUNT MEASURE ERROR MNSQ ZSTD MNSQ ZSTD |
|-----------------------------------------------------------------------------|
| MEAN 205.8 70.0 .00 .14 1.08 -.3 1.02 -.4 |
| S.D. 47.2 .0 .93 .02 .58 3.2 .53 2.9 |
| MAX. 290.0 70.0 2.45 .22 2.16 5.4 2.42 6.1 |
| MIN. 92.0 70.0 -1.65 .13 .31 -6.0 .39 -4.7 |
|-----------------------------------------------------------------------------|
| REAL RMSE .17 TRUE SD .92 SEPARATION 5.48 ITEM RELIABILITY .97 |
|MODEL RMSE .14 TRUE SD .92 SEPARATION 6.48 ITEM RELIABILITY .98 |
| S.E. OF ITEM MEAN = .27 |
+-----------------------------------------------------------------------------+
There is almost no difference in the person report. Person reliability does not change merely because the sample size becomes larger. Person reliability changes when the person distribution changes.
The biggest impact the lack of local independence has in this situation is to make the item standard errors too small. Consequently you might report item results as statistically significant that aren't.
So, with your current data, you could adjust the size of the item standard errors to their biggest "worst case" size:
Compute k = number of observations in your data / number of observations if each person had only been tested once
Adjusted item standard error = reported item standard error * sqrt (k).
This would also affect item Reliability computations:
Adjusted item separation coefficient = reported item separation coefficient / sqrt(k)
Adjusted item Reliability (separation index) = Rel. / ( k + Rel. - Rel.*k) =TRUE Sep**2 / (1+Adj.Sep.**2)
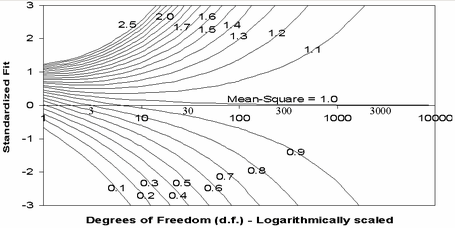
The size of the item mean-square fit statistics does not change, but you would also need to adjust the size of the item t standardized fit statistics (if you use them). This is more complicated. It is probably easiest to read them off the plot from Rasch Measurement Transactions 17:1 shown below.
Look at your current item mean-square and significance. Find the point on the plot. Go down to the x-axis. Divide the value there by k. Go to the same mean-square value contour. The "worst case" lower statistical significance value is on the y-axis.
Another noticeable aspect of your current data could be that there are misfitting subjects who were tested 9 times, while fitting persons are tested only twice. This would introduce a small distortion into the measurement system. So, arrange all the Tables in fit order, and look at each end, do some subjects appear numerous times near the end of a Table? If so, drop out those subjects and compare item calibrations with and without those subjects. If there is no meaningful difference, then those subjects are merely at the ends of the probabilistic range predicted by the Rasch model.