IPMATRIX= is only available from the Output Files pull-down menu. It constructs a rectangular matrix in which there is one row for each person and one column for each item, or vice-versa. The entries in the matrix are selected from the following screen:
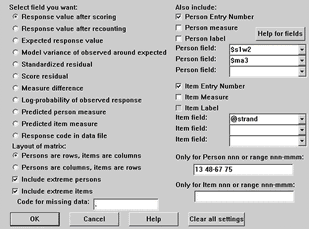
The first rows and columns can be the entry numbers, measures, labels and/or fields from the labels.
The matrix must contain one of
3. Original response value (after keying/scoring) (I4) (OBS)
4. Observed response value (after recounting) (I4) (ORD)
5. Expected response value (F7.3) (EXPECT)
6. modeled variance of observed values around the expected value (F7.3) (VAR)
This is also the statistical information in the observation.
Square root(modeled variance) is the observation's raw score standard deviation.
7. Standardized residual: (Observed - Expected)/Square root Variance (F7.3) (ZSCORE)
8. Score residual: (Observed - Expected) (F7.3) (RESID)
11. Measure difference (Person measure - Item measure) (F7.3) (MEASURE)
12. Log-Probability of observed response (F7.3) (LOGe(PROB))
13. Predicted person measure from this response (F7.3) (PMEASURE)
14. Predicted item measure from this response (F7.3) (IMEASURE)
15. Response code in data file (A) (CODE)
Field numbers shown here are those for XFILE=.
Depending on CSV=, data values are separated by "tab" or comma characters. In fixed field format, all fields are 7 characters long, separated by a blank. Missing data codes are "." as standard, but can be any character, or nothing.
1234567-1234567-1234567-1234567-1234567-1234567-1234567 ; these indicate fields.
. 1 2 3 4 5 6
1 8.85 -.223 . . . .
2 3.917 . 3.917 . . .
3 . 6.585 -.298 . . .
Example: I want a table of probabilities with items as the columns and possible scores as the rows, like the one on page 166 of Doug Cizek's book, Setting Performance Standards, based on work by Mark Reckase or Table 1 of MacCann & Stanley, "Rasch Standard Setting", Practical Assessment Research & Evaluation, 11, 2, 2
1. Analyze your data. Let's say the marks go from 0 to 14. We will use the KCT data as an example.
2. Output an IFILE=kctif.txt and an SFILE=kctsf.txt
3. Output the SCFILE=kctsc.xls for the raw scores, measures and percentiles for each possible raw score to Excel. This is the information for MacCann's Table, columns 1 (possible scores) and 2 (percentiles?). It looks like MacCann's column 2 is not "percentiles", but "cumulative frequency".
4. Add 1 to all the the raw scores 0-14 (+1) = 1-15 in the Excel file to become a "person number". Copy and paste the person number (1-15) column and the measure column into file: kctpf.txt - this will be a person anchor file for all the possible scores on the complete test.
5. Reanalyze your data with
Extra specifications? (copy and paste the next line)
IAFILE=kctif.txt SAFILE=kctsf.txt PAFILE=kctpf.txt PDELETE=16-9999
Analyze ...
Look at Tables 14, 18, (and 3.2 for polytomies) - all measures should be anchored "A"
Ignore fit statistics, etc.
6. Then output IPMATRIX= kctip.xls to Excel
Rows are the persons.
Columns are items.
Data are "Expected Response Values".
7. In the Excel spreadsheet, subtract 1 from person numbers in column 1 for the raw scores.
The other columns are the probabilities. Here is the KCT array in EXCEL after some editing. Add across the columns to confirm that the probabilities add up to the scores.
Score |
Item 4 |
Item 5 |
Item 6 |
Item 7 |
Item 8 |
Item 9 |
Item 10 |
Item 11 |
Item 12 |
Item 13 |
Item 14 |
Item 15 |
Item 16 |
Item 17 |
1 |
0.29 |
0.19 |
0.13 |
0.19 |
0.05 |
0.13 |
0.02 |
0.00 |
0.00 |
0.00 |
0.00 |
0.00 |
0.00 |
0.00 |
2 |
0.51 |
0.37 |
0.28 |
0.37 |
0.12 |
0.28 |
0.06 |
0.01 |
0.00 |
0.00 |
0.00 |
0.00 |
0.00 |
0.00 |
3 |
0.68 |
0.55 |
0.44 |
0.55 |
0.22 |
0.44 |
0.11 |
0.01 |
0.00 |
0.00 |
0.00 |
0.00 |
0.00 |
0.00 |
4 |
0.81 |
0.71 |
0.60 |
0.71 |
0.35 |
0.60 |
0.20 |
0.02 |
0.01 |
0.01 |
0.00 |
0.00 |
0.00 |
0.00 |
5 |
0.90 |
0.83 |
0.76 |
0.83 |
0.53 |
0.76 |
0.34 |
0.05 |
0.01 |
0.02 |
0.00 |
0.00 |
0.00 |
0.00 |
6 |
0.95 |
0.92 |
0.88 |
0.92 |
0.73 |
0.88 |
0.55 |
0.10 |
0.03 |
0.04 |
0.01 |
0.00 |
0.00 |
0.00 |
7 |
0.98 |
0.97 |
0.96 |
0.97 |
0.89 |
0.96 |
0.79 |
0.26 |
0.08 |
0.10 |
0.03 |
0.01 |
0.01 |
0.01 |
8 |
1.00 |
0.99 |
0.99 |
0.99 |
0.96 |
0.99 |
0.93 |
0.54 |
0.21 |
0.27 |
0.08 |
0.02 |
0.02 |
0.02 |
9 |
1.00 |
1.00 |
1.00 |
1.00 |
0.99 |
1.00 |
0.97 |
0.76 |
0.43 |
0.50 |
0.20 |
0.06 |
0.06 |
0.06 |
10 |
1.00 |
1.00 |
1.00 |
1.00 |
1.00 |
1.00 |
0.99 |
0.89 |
0.65 |
0.72 |
0.38 |
0.13 |
0.13 |
0.13 |
11 |
1.00 |
1.00 |
1.00 |
1.00 |
1.00 |
1.00 |
1.00 |
0.95 |
0.82 |
0.86 |
0.60 |
0.26 |
0.26 |
0.26 |
12 |
1.00 |
1.00 |
1.00 |
1.00 |
1.00 |
1.00 |
1.00 |
0.98 |
0.92 |
0.94 |
0.78 |
0.46 |
0.46 |
0.46 |
13 |
1.00 |
1.00 |
1.00 |
1.00 |
1.00 |
1.00 |
1.00 |
0.99 |
0.97 |
0.98 |
0.91 |
0.72 |
0.72 |
0.72 |