In Winsteps, item discrimination is not a parameter. It is merely a descriptive statistic.
Thoughts about item discrimination: Item discrimination and Rasch fit statistics are asymmetric. Noisy, unpredictable misfit (high mean-squares, large positive t-values, very low discrimination) degrade measurement. But too predictable overfit (low mean-squares, large negative, t-statistics, very high discrimination) do not degrade measurement. They merely cause standard errors to be estimated too low and reliabilities to be estimated too high - this is equivalent to the well-known "attenuation paradox" of CTT. So the useful range of discrimination is something like the range 0.5 to 2 or it could be 0.5 to infinity!! But when discrimination becomes very high (mean-squares very low), that usually means the items are malfunctioning in some way. Here is an informative paper on the topic of high item discrimination:
Journal of Educational Measurement, 25, 1, 15, 1988. "Item Discrimination: When More Is Worse" by Geofferey N. Masters.
High item discrimination can be a symptom of a special kind of measurement disturbance introduced by an item that gives persons of high ability a special advantage over and above their higher abilities. This type of disturbance, which can be interpreted as a form o f item "bias," can be encouraged by methods that routinely interpret highly discriminating items as the "best" items on a test and may be compounded by procedures that weight items by their discrimination. The type of measurement disturbance described and illustrated in this paper occurs when an item is sensitive to individual differences on a second, undesired dimension that is positively correlated with the variable intended to be measured. Possible secondary influences of this type include opportunity to learn, opportunity to answer, and test-wiseness.
The Rasch model specifies that item discrimination, also called the item slope, be uniform across items. This supports additivity and construct stability. Winsteps estimates what the item discrimination parameter would have been if it had been parameterized. The Rasch slope is the average discrimination of all the items. It is not the mean of the individual slopes because discrimination parameters are non-linear. Mathematically, the average slope is set at 1.0 when the Rasch model is formulated in logits, or 1.70 when it is formulated in probits (as 2-PL and 3-PL usually are). 0.59 is the conversion from logits to probits.
The empirical discrimination is computed after first computing and anchoring the Rasch measures. In a post-hoc analysis, a discrimination parameter, ai, is estimated for each item. The estimation model is of the form:
![]()
This has the appearance of a 2-PL IRT or "Generalized Partial Credit" model, but differs because the discrimination or slope parameter is not used in the estimation of the other parameters. The reported values of item discrimination, DISCR, are a first approximation to the precise value of ai obtained from the Newton-Raphson estimation equation:

The possible range of ai is -∞ to +∞, where +∞ corresponds to a Guttman data pattern (perfect discrimination) and -∞ to a reversed Guttman pattern. Rasch estimation usually forces the average item discrimination to be near 1.0. Consequently an estimated discrimination of 1.0 accords with Rasch model expectations. Values greater than 1.0 indicate over-discrimination, and values less than 1.0 indicate under-discrimination. Over-discrimination is thought to be beneficial in many raw-score and IRT item analyses. High discrimination usually corresponds to low MNSQ values, and low discrimination with high MNSQ values.
From an informal simulation study, Edward Wolfe reports Winsteps discrimination to have a .88 correlation with the generating slope parameters for a 2-PL dataset. BILOG has a .95 correlation.
Table 29.1 allows you to estimate the empirical item discrimination, at least as well as a 2-PL IRT computer program. This is because 2-PL discrimination estimation is degraded by the imputation of a person distribution and constraints on discrimination values. It is also skewed by accidental outliers which your eye can disregard. When Discrimination=Yes. exact computation is done in the measure tables.
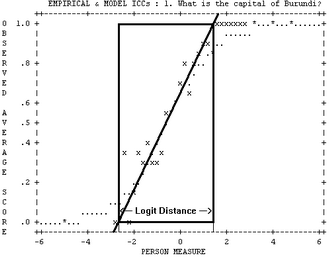
In Table 29.1 draw in the line that, to your eye, matches the central slope of the empirical item characteristic curve (ICC).

Estimate the logit distance from where the line intercepts the .0 score value to where it intercepts the 1.0 score value (for dichotomies). The logit distance here is about 4.0 logits.
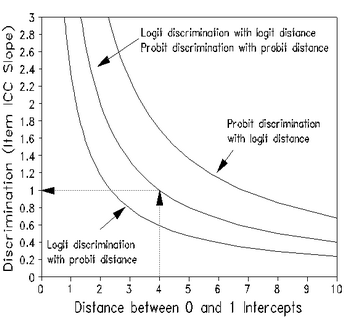
Use the central logit measure to logit discrimination line in this nomogram to estimate discrimination. In this nomogram, a logit distance of 4.0 logits, corresponds to a logit discrimination of 1.0, in accordance with model prediction. Steeper slopes, i.e., higher discriminations, correspond to shorter distances.
