This example illustrates two types of disordering in rating scale structures: category disordering and Rasch-Andrich threshold disordering. For further discussion, see disordering. It also illustrates anchor values in the person labels and category labeling.
The control file and data are in exam16.txt.
; This control file is EXAM16.TXT
title = "Attitude Survey illustrating two types of disordering"
ni = 3 ; three items
item1 = 1 ; item responses start in column 1
xwide = 2 ; data codes are two columns wide
codes = "1 2 3 " ; valid two character codes
name1 = 9 ; person label starts in column 9
namelength = 3 ; length of person labels
; pafile = $s1w3 ; person anchor values in columns 1-3 of person labels
@panchors = 1-3 ; person anchor field is in columns 1 to 3 of person labels
pafile = @panchors ; person anchors in field @panchors
ISGROUPS = 0 ; allow each item to have its own rating scale (the partial credit model)
clfile = * ; category labels: item+category
1+1 Never ; item 1 category 1 is "Never"
1+2 Sometimes ; well-behaved rating scale
1+3 0ften
2+1 Car ; categories as ordered in frequency in 1930
2+2 Ship ; now these categories are disordered
2+3 Plane ; ship travel now rarer than planes
3+1 No
3+2 Neutral ; very few in this narrow intermediate category
3+3 Yes
*
&END ; item labels follow
Smooth advance everywhere - probability curves a "range of hills"
Disordered categories - disordered empirical average measures for categories
Low middle frequency - high discrimination - disordered Rasch-Andrich thresholds
END LABELS ; end of item labels, data follow ...
1 1 1 0.0 ; person anchor logits in person labels
1 1 1 0.1 ; advancing anchored person measures
2 3 1 0.2 ; but not advancing categories for item 2
2 3 1 0.3
2 2 2 0.4 ; only one observation of category 2 for item 3, but in the correct place = high discrimination
2 2 3 0.5
2 2 3 0.6
3 2 3 0.7
3 2 3 0.8 ; last data record
On the Diagnosis Menu: Empirical Item-Category Measures:
TABLE 2.5 Attitude Survey
OBSERVED AVERAGE MEASURES FOR PERSONS (BY OBSERVED CATEGORY)
0 1 2 3 4 5
+-----+-----+-----+-----+-----| NUM ITEM
| 1 2 3 | 1 Smooth advance everywhere
| 1 3 2 | 2 Disordered categories
| 1 2 3 | 3 Low middle frequency - high discrimination
+-----+-----+-----+-----+-----| NUM ITEM
On the Diagnosis Menu: Category Function:
TABLE 3.2 Attitude Survey
FOR GROUPING "0" ITEM NUMBER: 1 Smooth advance everywhere - probability curves a "range of hills"
ITEM DIFFICULTY MEASURE OF 2.00 ADDED TO MEASURES
+------------------------------------------------------------------
|CATEGORY OBSERVED|OBSVD SAMPLE|INFIT OUTFIT|| ANDRICH |CATEGORY|
|LABEL SCORE COUNT %|AVRGE EXPECT| MNSQ MNSQ||THRESHOLD| MEASURE|
|-------------------+------------+------------++---------+--------+
| 1 1 2 22| 1.00 1.62| .49 .52|| NONE |( -.29)| 1 1 Never
| 2 2 5 56| 2.00 2.00| .00 .00|| -1.11 | 2.00 | 2 2 Sometimes <- Ordered Rasch-Andrich thresholds
| 3 3 2 22| 3.00 2.38| .49 .52|| 1.11 |( 4.29)| 3 3 0ften <- Ordered categories
+------------------------------------------------------------------
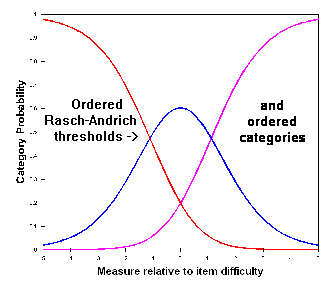
TABLE 3.3 Attitude Survey
FOR GROUPING "0" ITEM NUMBER: 2 Disordered categories - disordered empirical average measures for categories
ITEM DIFFICULTY MEASURE OF 2.00 ADDED TO MEASURES
+------------------------------------------------------------------
|CATEGORY OBSERVED|OBSVD SAMPLE|INFIT OUTFIT|| ANDRICH |CATEGORY|
|LABEL SCORE COUNT %|AVRGE EXPECT| MNSQ MNSQ||THRESHOLD| MEASURE|
|-------------------+------------+------------++---------+--------+
| 1 1 2 22| 1.00 1.62| .49 .52|| NONE |( -.29)| 1 1 Car
| 2 2 5 56| 2.40 2.00| 1.01 1.01|| -1.11 | 2.00 | 2 2 Ship <- Ordered Rasch-Andrich thresholds
| 3 3 2 22| 2.00* 2.38| 1.28 1.23|| 1.11 |( 4.29)| 3 3 Plane <- Disordered categories
+------------------------------------------------------------------
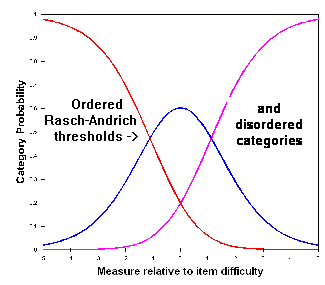
TABLE 3.4 Attitude Survey
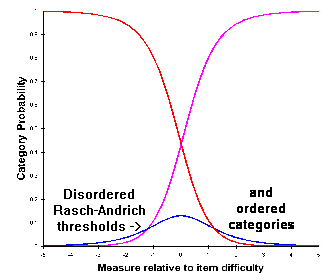
FOR GROUPING "0" ITEM NUMBER: 3 Low middle frequency - high discrimination - disordered Rasch-Andrich thresholds
ITEM DIFFICULTY MEASURE OF 2.00 ADDED TO MEASURES
+------------------------------------------------------------------
|CATEGORY OBSERVED|OBSVD SAMPLE|INFIT OUTFIT|| ANDRICH |CATEGORY|
|LABEL SCORE COUNT %|AVRGE EXPECT| MNSQ MNSQ||THRESHOLD| MEASURE|
|-------------------+------------+------------++---------+--------+
| 1 1 4 44| 1.50 1.65| .74 .64|| NONE |( .86)| 1 1 No
| 2 2 1 11| 2.00 2.00| .00 .00|| 1.21 | 2.00 | 2 2 Neutral <- Disordered Rasch-Andrich thresholds
| 3 3 4 44| 2.50 2.35| .74 .64|| -1.21 |( 3.14)| 3 3 Yes <- Ordered categories
+------------------------------------------------------------------