The Diagnosis pull-down menu suggests a step-by-step procedure for investigating the results of your analysis.
Click on the Table name to go to the Table description:
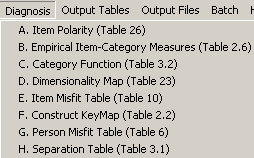
A. Item Polarity: check that all items are aligned in the same direction on the latent variable, same as Table 26. Check that all items have positive correlations. Use IREFER= and IVALUE= to point all items in the same direction, or KEY1= to correct a multiple-choice key error. IDFILE= to delete (for the moment) uncooperative items.
B. Empirical Item-Category Measures: check that all categories for all items are aligned in the same direction, same as Table 2.6. For multiple-choice items, see Table 2 for MCQ. Check that Edit menucorrect answers, and higher category values corresponding to "more" of the variable, are to the right.
C. Category Function: check that all categorization functioned as intended, same as Table 3.2. Check that the "average measures" for the categories advance, and that no category is especially noisy. Use IREFER= and IVALUE= to collapse or remove discordant categories. Use ISGROUPS= to identify category functioning. If more details are required, look at the option/distractor analysis of the Item Tables.
D. Dimensionality: check that all items share the same dimension, same as Table 23. This identifies sub-structures, "secondary dimensions", in the data by performing a principal components/contrast decomposition of the observation residuals. If there are large sub-structures, then it may be wiser to divide the data into two measurement instruments.
E. Item Misfit: check that items cooperate to measure, same as Table 10. Are there misbehaving items? Look for large mean-squares, and also for contradictory use of responses in the option/distractor listing.
F. Construct KeyMap: check that the item hierarchy is as intended (construct validity), same as Table 2.2. This locates items, response categories and your sample in one picture. Does your item measure hierarchy make sense? What is the typical person in your sample saying?
G. Person Misfit: check that persons cooperate to measure, same as Table 6. Are there misbehaving persons? Look for large mean-squares, and also look at the unexpected observations in the Most Unexpected Responses subtable.
H. Separation: check that the items discriminate different levels of person performance ("test" reliability), same as Table 3.1. Also that persons are able to discriminate differences in item calibration.