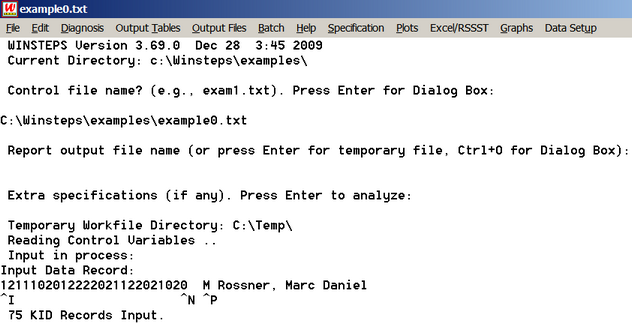
While WINSTEPS is running, information about the analysis is displayed on the screen. The iterative estimation process is by logistic curve-fitting. Here is an example based on the "Liking for Science" data, example0.txt
The winsteps analysis window can display:
WINSTEPS Version: 3.73.0
program running - shows version number
Reading Control Variables .. Processing your control variables
Input in process ...... Reading in your data: each . is 1,000 persons
1211102012222021122021020 M Rossner, Marc Daniel
^I ^N ^P
^I where item response string starts, ITEM1=
^N last item response, NI=
^P where person label starts, NAME1=
75 person records input Total person records found
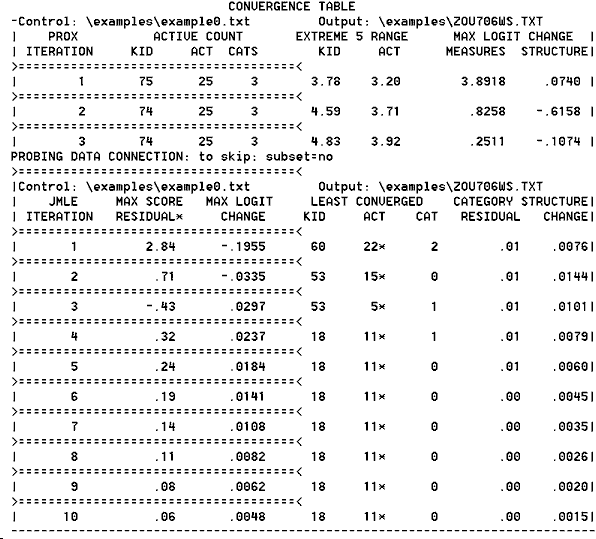
To stop iterations: press Ctrl+S
To cancel the analysis: press Ctrl+F
CONVERGENCE TABLE: See Table 0.2
PROBING DATA CONNECTION: See SUBSETS=
PROX and JMLE: See Estimation methods
Check that values diminish, and become near 0. See convergence considerations
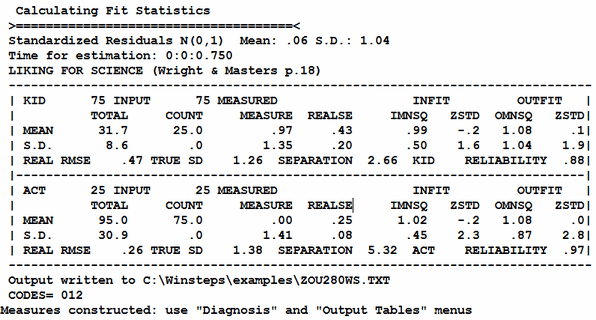
CALCULATING FIT STATISTICS
During this iteration through the data, the person and item fit statistics are computed. The exact formulae are in the book Rating Scale Analysis, p. 100 - also at Fit Equations.
Summary statistics are extracted from Table 3.1 with REALSE=Yes and including extreme scores.