The Rasch model formulates a non-linear relationship between non-linear raw scores and additive measures. So, estimating measures from scores requires a non-linear process. This is performed by means of iteration. Two estimation methods are used, PROX and JMLE.
The fundamental transformation in linearizing raw scores is:
log ( (observed raw score - minimum possible raw score) / (maximum possible raw score - observed raw score) )
In Winsteps, initially every person is estimated to have the same ability measure at the origin of the measurement scale. Each item is estimated to have the same difficulty measure, also at the origin of the measurement scale. Each rating scale structure parameter, Rasch-Andrich threshold, is also estimated to be 0.
In Winsteps, the first phase of estimation uses the PROX (normal approximation) estimation algorithm. This takes the initial set of estimates and produces revised estimates:
![]()
where Bn is the revised ability estimate for person n, mn is the mean difficulty of the items encountered by person n, and sn is the standard deviation of those item difficulties. Rn is the observed raw score for person n and Nn is a perfect, maximum possible score on those same items. Similarly, for the items,
![]()
where Di is the revised difficulty estimate for item i, mi is the mean ability of the persons encountering by item i, and si is the standard deviation of those person abilities. Ri is the observed raw score on item i and Ni is a perfect score by those same persons.
To update these PROX estimates, Winsteps traverses the data computing the values of all the terms on the right-side of the estimation equations. This traversal is called an "iteration". When the increase in the range of the person or item measures is smaller than 0.5 logits, or when MPROX= is reached, iteration ceases.
Initial estimates of the Rasch-Andrich threshold between category k and category k-1 are obtained from log (observed frequency of category k-1 / observed frequency of category k) normalized to sum to zero across the thresholds of a rating scale.
The PROX estimates become the starting values for JMLE (Joint Maximum Likelihood Estimation). Using these person, item and rating scale structure estimates, Winsteps computes the expected value, according to the Rasch model, corresponding to each observation in term. After iterating through the entire data set, the marginal sums of these expected values, the person expected raw scores and the item expected raw scores, are compared with their observed (empirical) values. If a person's expected raw score is less than that person's observed raw score, then the ability estimate raised. If the person's expected raw score is greater than the observed score, then the ability estimate is lowered. For items, if the expected raw score is less than the observed score, then the difficulty estimate is lowered. If the item's expected raw score is greater than the observed score, then the difficulty estimate is raised.
The estimation equations for JMLE are derived in RSA, where Newton-Raphson iteration is employed.
y' = y + (observed score - Rasch expected score based on current estimates)/(modeled variance)
where y = a current estimated person measure and y' is the improved estimate.
Newton-Raphson estimation has proved unstable with sparse data sets and also with rating scales which have alternating very high and very low frequency categories. Accordingly, Winsteps implements a more robust proportional-curve-fitting algorithm to produce JMLE estimates. The relationship between raw scores and measures is always monotonic, so the characteristic curve for each person or item parameter is modeled to have the local form of a logistic ogive:
y = a * log( (x-l)/(h-x) ) + c
where y = an estimated measure, a = slope of the ogive, x = a raw score, l = the known minimum possible raw score for the parameter, h = the known maximum possible raw score for the parameter, c = location of ogive relative to local origin.
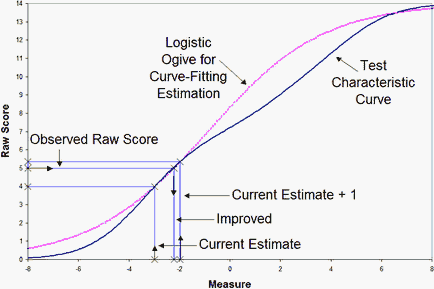
Values of x are obtained form the current estimated measure y and a nearby measure (y + d). From these, a and c are estimated. The revised measure y' is obtained by evaluating the equation using the observed raw score as the value of x. In the plot below for Example 1, the current estimate, y, is -3 logits, a nearby estimate, y+d, is -2 logits. These both estimate raw scores on the currently-estimated test characteristic curve (TCC, the remainder of which is not yet known). The violet line is the logistic ogive going through these two known points. It is close to the putative TCC. The observed score of "5" is then found on the logistic ogive and an improved estimate is obtained. After all the person and item estimates are improved, the estimated TCC changes and this estimation process is repeated by performing another iteration through the data. Winsteps sets d equal to the biggest logit change in any item or person estimate in the previous iteration. This rapidly becomes much less than 1.0.
For the rating scale structure, the estimate, yk, for Rasch-Andrich threshold k is improved by
yk' = yk - log ( observed count category k / observed count category k-1)
+ log (estimated count category k / estimated count category k-1)
When the various convergence criteria are satisfied, iteration ceases and the final estimates are obtained. These are used in computing fit statistics.
Example: Here is the iteration Table for example0.txt:
CONVERGENCE TABLE
+----------------------------------------------------------------------------+
| PROX ACTIVE COUNT EXTREME 5 RANGE MAX LOGIT CHANGE |
| ITERATION KIDS ACTS CATS KIDS ACTS MEASURES STRUCTURE|
|----------------------------------------------------------------------------|
| 1 75 25 3 3.78 3.20 3.8918 .0740 |
| 2 74 25 3 4.59 3.71 .8258 -.6158 |
| 3 74 25 3 4.83 3.92 .2511 -.1074 |
|----------------------------------------------------------------------------|
| JMLE MAX SCORE MAX LOGIT LEAST CONVERGED CATEGORY STRUCTURE|
| ITERATION RESIDUAL* CHANGE KID ACT CAT RESIDUAL CHANGE |
|----------------------------------------------------------------------------|
| 1 2.84 -.1955 60 22* 2 21.44 .0076|
| 2 .71 -.0335 53 15* 0 -5.89 .0144|
| 3 -.43 .0293 53 5* 1 3.48 .0101|
| 4 .32 .0235 18 11* 1 2.71 .0079|
| 5 .24 .0184 18 11* 0 -2.09 .0060|
| 6 .19 .0141 18 11* 0 -1.63 .0045|
| 7 .14 .0108 18 11* 0 -1.25 .0035|
| 8 .11 .0082 18 11* 0 -.96 .0026|
| 9 .08 .0062 18 11* 0 -.73 .0020|
| 10 .06 .0048 18 11* 0 -.56 .0015|
+----------------------------------------------------------------------------+
In the top section of the Convergence Table are reported the number of active persons, items and categories. The range of item and person measures at the end of each PROX iteration is shown, also the biggest change in any person or item, and in any Rasch-Andrich threshold. PROX iteration ceases with iteration 3 because the "KIDS" (persons) and "ACTS" (items) range has increased by less than 0.5 logits.
In the lower section, for each JMLE iteration, the maximum score residual, the biggest difference between any observed and expected marginal score is shown. Also the biggest change in any measure. Iteration ceases when the values, in iteration 10, are less than the convergence criteria.