Please do not interpret this as a usual factor analysis. These plots show contrasts between opposing factors, not loadings on one factor. For more discussion, see dimensionality and contrasts.
This Table decomposes the matrix of item (Table 23) or person (Table 24) correlations based on residuals to identify possible other contrasts (dimensions) that may be affecting response patterns. Specify PRCOMP=S or =R or =L to obtain this Table.
Prior to this first contrast, the Rasch dimension has been extracted from the data. Residuals are those parts of the observations not explained by the Rasch dimension. According to Rasch specifications, these should be random and show no structure. The contrasts show conflicting local patterns in inter-item (or inter-person) correlations based on residuals or their transformations. Letters "E", "b", etc. relate items (or persons) to their loadings on the first contrast. In this Table, Bladder and Bowel contrast with Dressing. Since Bladder and Bowel misfit, they load on a second dimension in the data.
The loading is that on the first PCA contrast. In the factor analysis literature, values of ±.4 or more extreme are considered substantive.
The measures and mean-square statistics are the same as those reported in Table 10 (or Table 6) etc.
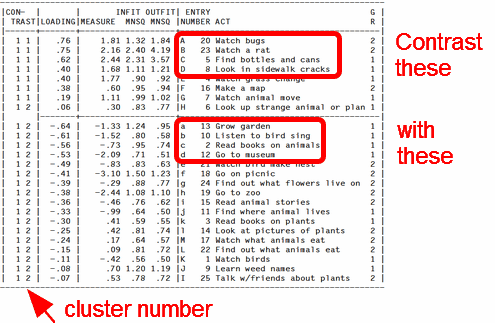
The letters under "ENTRY NUMBER" refer to the plots in Table 23.2 (or Table 24.2).
The "cluster number" indicates a statistical clustering of the loadings (useful for splitting into two or more less-multi-dimensional subtests).
To copy numbers out of this Table, use WORD to copy a rectangle of text.