Previous Next


Inventory > Sales > Forecasting


Forecasting
Forecasting is a feature that predicts sales and guests for future weeks using sales data collected in the Inventory System through the POS Import process. The system forecasts your sales and guests for each day of the selected week using last year’s data or this year’s data. The Forecasting feature also forecasts sales intervals (Half Hour Sales) based on the forecasted daily sales and also forecasts a Sales Mix.
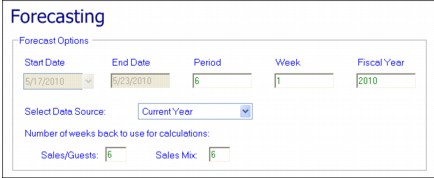
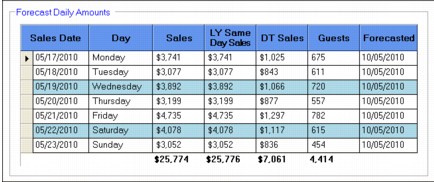
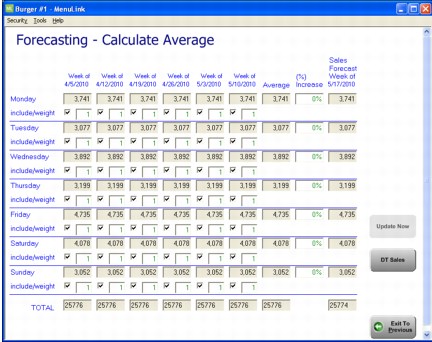
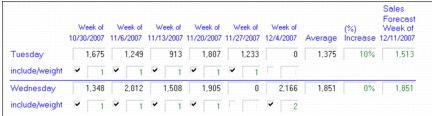
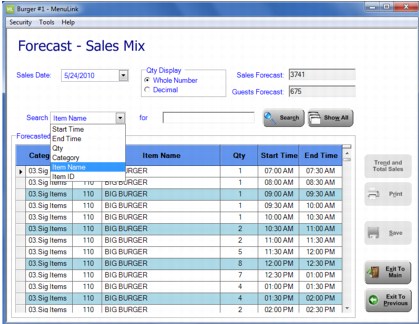
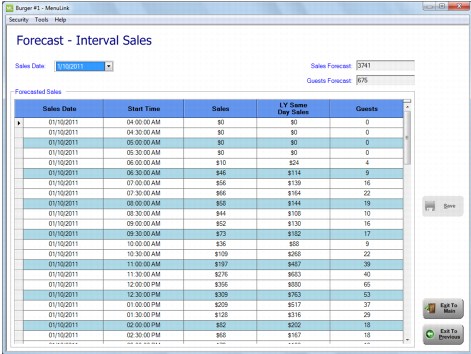
The Sales and Guests forecast is used in several features including Order by Forecasting, Prep Scheduling, and Recommended Staffing based on your Staffing matrix.
After forecasting the daily sales, MenuLink Client takes the daily sales total and calculates the sales for each half hour of the day. MenuLink Client uses the forecasted half hour sales in the Labor Scheduling feature to calculate staffing requirements per half hour using the staffing matrices that have been set up through the Labor Staffing feature.
Note: More information on Forecasting can be found in the Projected Data section of this guide, including event information and forecasting by alternate sales type.
Creating a New Forecast
To Create New Sales and Guest Forecast:
1.
Note: You can also access Forecasting through the Labor Switchboard by clicking Projected Data.
CL_SalesMain
2.
In the Forecasting screen, enter the period number and week number to define the date range to be forecasted.
CL_Forecasting_Options
3.
In Select Data Source, choose the data that to use: Current Year or Previous Year.
4.
Enter the number of weeks for Sales/Guest and Sales Mix. This defines which data MenuLink Client will use to calculate the forecast.
5.
Click New Forecast.
MenuLink Client generates the sales and guest forecast which is listed in the Forecast Daily Amounts area.
CL_Forecasting_DailyAmts
6.
This table contains the sales date and day, as well as the forecast sales. It also contains the sales for the same date last year (LY Same Day Sales) as well as the alternate sales forecast. The alternate sales forecast is defined by your system administrator and displays the forecast sales for a specific area or item category for your site. In this example, we have forecast Drive Thru sales, which helps drive recommended staffing for the Drive Thru area of the site.
7.
Also shown are the number of forecast guests and the date the forecast was made.
8.
a)
In the Forecasted Daily Amounts area, select the sales amount for the day you want to modify, and then enter the new sales amount. You can also adjust the alternate sales forecast.
b)
c)
Click Reforecast Intervals.

Forecast by Average
The Forecast by Average feature shows the individual sales forecasted for each day based on information from up to six prior weeks. You can change the sales forecast, percentage of increase (or decrease), days to exclude from the calculation, and the weight.
To Create a Forecast by Average:
1.
CL_Forecasting_ByAverage
2.
3.
4.
Note: MenuLink Client may automatically exclude the high and low sales for a selected week, as defined by your system administrator.
5.
In the following example, Tuesday’s average calculation does not include sales for the week of 12/4/07 and Wednesday’s calculation does not include sales for the week of 11/27/07. Wednesday’s sales amount for week of 12/4/07 has been weighted at twice the weight of the other sales days. In the % of Increase for Tuesday has been set at 10%.
CL_Forecasting_ByAverage2
Below is the calculation used to create the Sales Forecast for Tuesday.
Below is the calculation used to create the Sales Forecast for Wednesday.
6.
Click Exit to Previous to return to the Forecasting screen
7.
Click Save to save any changes made to the forecast.
Show Sales Mix
Use the Show Sales Mix feature to show the forecasted sales mix for the selected day. The Forecast-Sales Mix data can be sorted by Item Name, Category, Start Time, End Time, Quantity and Item ID.
To Create a Daily Sales Mix:
1.
CL_Forecasting_SalesMix
2.
To change the forecasted daily sales mix to another day in the forecast week, click the arrow to the right of the Sales Date field and select a date.
3.
Click Exit to Previous to return to the Forecast screen.

Show Intervals
Use the Show Intervals feature to view the forecasted sales and guests broken down into a predefined interval (15 minutes, 30 minutes or 60 minutes) for the selected date.
To Create a Sales and Guest Interval Forecast:
1.
2.
To change the display to another day in the forecast week, click the arrow to the right of the Sales Date field and select a date.
3.
Click Exit to Previous to return to the Forecast screen.

MenuLink Online Help
Copyright © 2012 Radiant Systems, Inc. All rights reserved.