STATISTICA Graphs are virtually unlimited in all respects. Because of the optimized manner in which STATISTICA creates and manages graphs, the options and customizations pertaining to aspects of the graph itself (e.g., colors, line styles, etc.) usually only require minimal space, and managing even complex graphs (e.g., saving graphs to files, moving them around workbook, attaching graphs to e-mail messages) is efficient and fast.
However, when graphing large data sets (e.g., with several hundreds
of thousands of cases),
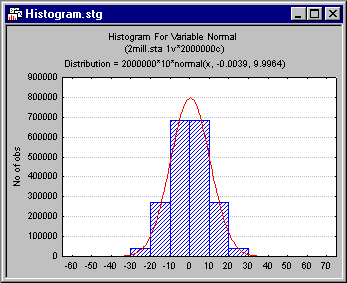
Example: Storing frequency counts instead of raw data for histograms. Consider a histogram computed for 2,000,000 (2 million) observations; further suppose you used the default method of categorization to assign the observations to the bin's for the histogram, and this method yielded 6 categories (columns in the histogram).

The histogram itself only shows the summary frequency counts for the
6 bins, given the chosen method of categorization.
Therefore, it is not necessary to store and save the raw data values (i.e.,
the 2 million data points) along with the graph; only the 6 frequency
counts need to be saved. By not storing and saving the raw data itself,
the graph object (graph file)
Of course, once you "detach" the raw data from the histogram by not storing the original data points, but only the aggregated frequency counts, you can no longer "go back" to the data. Thus, you cannot, for example, double-click on the graph to display the Graph Options dialog, select the Plot: Histogram options pane, and change the method of categorization to, for example, make a histogram with 20 bins (categories). That would require to reprocess the data, which were not stored along with the graph. The only way to do this would be to go back to the original input data file, and create the graph using the standard 2D Graphs options from the Graphs menu. However, if you had no access to the original data that were used to create the graph (e.g., if someone had e-mailed to you the STATISTICA graphics file as an attachment), then you could not change the way in which the data were categorized to produce the histogram.
Attaching the data to the graph. By default, STATISTICA will always attach the original data to the graph. In most cases, for example when dealing with data files that have less than 100,000 observations, STATISTICA will manage such graphs very efficiently. Therefore, all options in the Graph Options dialog will be available to customize the graph, and to recompute various aspects of the graph (e.g., to redo the method of categorization in histograms), even if the original input data is not available to you (e.g., if the graph was sent to you as an attachment to an e-mail). You can also review and edit the original input data via the Graph Data Editor options of the Graphics View menu.
Options for Managing Large Data Sets and Graphs. STATISTICA will by default attach to (store along with) the graph the original data necessary to produce the graph. However, you can configure the threshold value (number of observations) at which point you want to be given a choice as to whether or not you want to store the raw data along with the graph, or only the aggregated summaries. When the data file contains more valid observations than this threshold value, and you create a graph summarizing the data (see also the next paragraph regarding the relevant graphs), the Large Data Warning dialog will be displayed where you can choose to attach or not to attach the data to the graph. These options (threshold value, whether or not to display the Large Data Warning dialog) can be configured in the Large Data Warning dialog and via the respective options on the Analyses/Graphs tab of the Options dialog accessible by selecting Options from the Tools menu.
Graphs and options that require the
raw data.
Some graphs, of course, plot the raw data points themselves (e.g., scatterplots), or some transformation of the data (e.g., probability plots). For those graphs, STATISTICA will always attach the raw data, since each observation corresponds to a point in the graph, and without the data for each point the graph couldn't be drawn. The Large Data Warning dialog will not be displayed for those graphs, and storing and managing such graphs can require large processing resources when truly huge data sets are used in the analyses.