Select by clicking on "Empirical ICC" or from the Graphs menu.
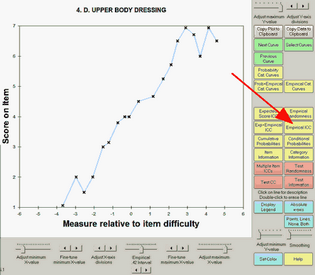
Line: This shows the empirical (data-descriptive) item characteristic curve. Each black "x" represents observations in an interval on the latent variable. The "x" is positioned at the average rating (y-axis) at the average measure (x-axis) for observations close by. "Close by" is set by the empirical slider beneath the plot. The blue lines are merely to aid the eye discern the trend. The curve can be smoothed with the "smoothing" slider. The Points button controls whether points+lines, points or lines are displayed.
Buttons are described in Graph window.