Winsteps produces bit-mapped images, using the Graphs menu. Winsteps produces character-based graphs in Table 21
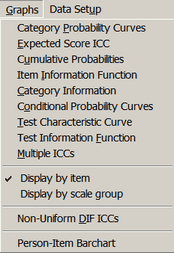
Initially, select which type of curves you want to see. When the graphs display, you can select the other options. You can look at the others later without going back to this menu. Graphs are plotted relative to the central difficulty of each item or response structure. Model-based curves (such as probability and information functions) are the same for all items which share the same model definition in ISGROUPS=. Empirical curves differ across items.
Category Probability Curves: model-based probability of observing each category of the response structure at each point on the latent variable (relative to the item difficulty)
Empirical Category Curves: data-based relative frequencies of categories in each interval along the latent variable
Expected Score ICC shows the model-based Item Characteristic Curve (or Item Response Function IRF) for the item or response structure. This is controlled BYITEM= or the last two entries in this menu.
Empirical ICC shows the data-based empirical curve.
Empirical randomness shows the observed randomness (mean-square fit) in each interval on the variable with logarithmic scaling. The model expectation is 1.0
Cumulative Probabilities plot the model-based sum of category probabilities. The category median boundaries are the points at which the probability is .5. Click on a line to obtain the category accumulation.
Item Information Function plots the model-based Fisher statistical information for the item. This is also the model variance of the responses, see RSA p. 100.
Category Information plots the model-based item information partitioned according to the probability of observing the category. Click on a line to obtain the category number.
Conditional Probability Curves show the model-based relationship between probabilities of adjacent categories. These follow dichotomous logistic ogives. Click on a line to obtain the category pairing.
Test Characteristic Curve is the model-based test score-to-measure characteristic curve.
Test Information Function plots the model-based test information function, the sum of the item information functions.
Test randomness shows the observed randomness (mean-square fit) in each interval on the variable with logarithmic scaling. The model expectation is 1.0
Multiple Item ICCs supports the display of several model and empirical ICCs simultaneously.
Display by item shows these curves for individual items, also controlled by BYITEM=. Model-based output is the same for all items with the same ISGROUPS= designation.
Display by scale group for each ISGROUPS= code, a set of curves is shown. An example item number is also shown - all other items in the grouping are included in the one set of grouping plots. Also controlled by BYITEM=.
Non-Uniform DIF ICCs shows the empirical item characteristic curve for each DIF= person-classification-group.
Person-item Barchart shows the distributions of the person abilities and item difficulties as a vertical barchart.