|
|
|
If you don't see all this on your screen, you may have your screen resolution set to 800 x 600 pixels. Try setting it to 1024 x 768. Windows "Start", "Settings", "Control Panel", "Display", "Settings", Move "Screen resolution" slider to the right.
Button or Slider |
Function |
Right-hand side: |
|
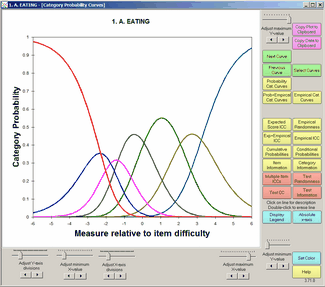
Adjust maximum Y-value |
Sets the maximum value on the vertical Y-axis |
Copy Plot to Clipboard |
Copies the graph to the Windows clipboard. This only copies the part of the plot that is visible on your screen. Maximize the chart window and increase your screen resolution if the entire plot is not visible. To increase screen resolution: Windows "Start", "Settings", "Control Panel", "Display", "Settings" and move the "Screen resolution" slider to the right. Open a graphics program, such as Paint, and paste in the image for editing. |
Copy Data to Clipboard |
Copies the graphed numbers to the Windows clipboard (for pasting into Excel, etc.) Use paste special to paste as a picture meta-file, bitmap or as a text listing of the data points. Each row corresponds to a set of points to plot: Column A - ignore Column B - x-axis for point on first curve Column C - y-axis for point on first curve Column D - x-axis for point on second curve Column E - y-axis for point on second curve etc. Plot: Column B (x-axis) against Column C (y-axis) Column D (x-axis) against Column E (y-axis) etc. |
Next Curve |
Displays the same graph for the item with the next higher entry number. |
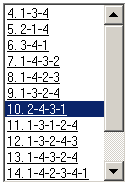
Select Curves |
Displays the graph for the selected item from the curve-selection-box: |
Previous Curve |
Displays the same graph for the item with the next lower entry number. |
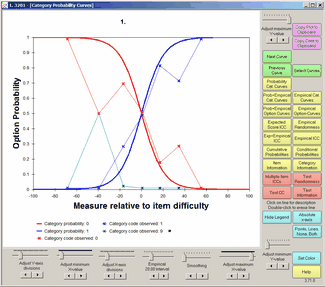
Probability Cat. Curves |
Displays the Rasch-model probability-curve for each response-category |
Displays the Rasch-model curve for the item and the empirical DIF curves for the DIF classifications groups when "Non-uniform DIF" is clicked on the Graphs Menu, |
|
Prob+Empirical Cat. Curves |
Displays the Rasch-model probability-curve for each response-category, together with the empirical curve summarizing the data in each empirical interval. |
Displays the empirical curve for each response-category, summarizing the data in each empirical interval |
|
Prob+Empircal Option Curves |
Displays the Rasch-model probability-curve for each response-option, together with the empirical curve summarizing the data in each empirical interval. |
Empirical Option-Curves |
Displays the empirical curve for each response-option, summarizing the data in each empirical interval |
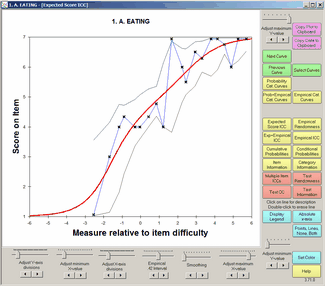
Displays the expected-score item characteristic curve, the item's Rasch-model logistic ogive. |
|
Displays the fit of the item, summarizing the data in each empirical interval |
|
Displays the expected-score item characteristic curve, the item's Rasch-model logistic ogive, together with the empirical ICC summarizing the data in each empirical interval. |
|
Displays the item's empirical item characteristic curve, summarizing the data in each empirical interval. |
|
Displays the Rasch-model cumulative probability-curve for each response-category and the categories below it. |
|
Displays the Rasch-model probability-curve for the relative probability of each adjacent pair of categories. These are dichotomous ogives. |
|
Displays the item-information function according to the Rasch model. |
|
Displays the information function for each category according to the Rasch model. |
|
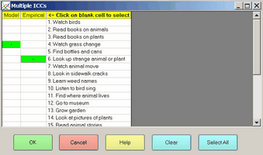
Displays multiple Rasch-model and empirical item characteristic curves as selected in the ICC-selection box. |
|
Displays the fit of all the items in the test, summarizing the data in each empirical interval |
|
Displays the Rasch-model test characteristic curve, showing the relationship between raw scores and Rasch measures on the complete test of all active items. |
|
Displays the test-information function according to the Rasch model. The inverse square-root of the test information is the standard error of the Rasch person measure. |
|
Click on line for description |
Click on a curve to show its description below the graph. You can identify an individual traceline by single-left-clicking on it. Its description will then appear below the plot. Click elsewhere on the plot to remove the selection indicators. |
Double-click to erase line |
You can remove a traceline by double-left-clicking on it. Click on the command button, e.g., "Probability Curves", to return the plot to its initial appearance. |
Display Legend Hide Legend |
Click on "Display legend" to show descriptions of all the curves below the graph. Click on "Hide legend" to remove the descriptions. |
Absolute x-axis Relative x-axis |
Click on "Absolute x-axis" to show the graphs with measures on the latent variable along the x-axis. Click on "Relative x-axis" to show the graphs with the x-axis plotted relative to the item difficulty. |
Flip Curves Vertically |
Reverses the cumulative probability curves on the y-axis |
Click on this button to show the empirical curves as both points("x") and lines, points only, lines only, and neither points nor lines. |
|
Adjust minimum Y-value |
Sets the minimum value on the vertical Y-axis |
Smoothing |
Controls the degrees of smoothing of the empirical curve |
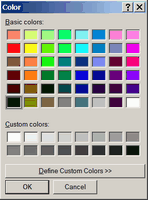
Set Color |
Click on a curve to select it, the click on "Set Color" to change its color using the color-selection-box. White makes the line disappear. |
Help |
Click on Help to display this page. |
Across the bottom: left to right |
|
Adjust Y-axis divisions |
Sets the number of tick-marks on the Y-axis |
Adjust minimum X-value |
Sets the minimum value on the horizontal X-axis |
Adjust X-axis divisions |
Sets the number of tick-marks on the X-axis |
Empirical interval |
Sets the number of empirical summary-intervals on the X-axis |
Adjust maximum X-value |
Sets the maximum value on the horizontal X-axis |
Curve selection Box |
|
||
ICC Selection Box |
|
||
Color Selection Box |
|