This uses MFORMS=, but it can also be done, more awkwardly, with FORMAT=
Test A, in file EXAM10A.TXT, and TEST B, in EXAM10B.TXT, are both 20 item tests. They have 5 items in common, but the distractors are not necessarily in the same order. The responses must be scored on an individual test basis. Also the validity of each test is to be examined separately. Then one combined analysis is wanted to equate the tests and obtain bankable item measures. For each file of original test responses, the person information is in columns 1-11, the item responses in 41-60.
The combined data file specified in EXAM10C.TXT, is to be in RFILE= format. It contains
Person information of 11 characters: Columns 1-30 (always), but only 1-11 are active.
Item responses to 35 items: Columns 31-64
The identification of the common items is:
Test Item Number (=Location in item string) |
|||||||
Bank |
1 |
2 |
3 |
4 |
5 |
6-20 |
21-35 |
A: |
3 |
1 |
7 |
8 |
9 |
2, 4-6, 10-20 |
|
B: |
4 |
5 |
6 |
2 |
11 |
|
1, 3, 7-10, 12-20 |
I. From Test A, make a response (RFILE=) file..
; This file is EXAM10A.TXT
TITLE="Analysis of Test A"
RFILE=EXAM10AR.TXT ; The constructed response file for Test A
NI=20 ; 20 items
ITEM1=41 ; Items start in column 41 of data record
NAME1=1 ; Start of person label
NAMELEN=11 ; Length of person label
CODES="ABCD# " ; Beware of blanks and # meaning wrong!
; Blanks are included in CODES=, but they are scored incorrect, because never keyed correct
KEY1=CCBDACABDADCBDCABBCA ; the MCQ key
&END
BANK 2 TEST A 1 ; first item name
BANK 6 TEST A 2
BANK 1 TEST A 3
.
BANK 20 TEST A 20
END NAMES
Person 01 A BDABCDBDDACDBCACBDBA
.
Person 12 A BADCACADCDABDDDCBACA
The RFILE= file, EXAM10AR.TXT, is:
0 1 2 3 4 5
12345678901234567890123456789012345678901234567890
Person 01 A 00000000110010001001
.........
Person 12 A 00001110000001001011
II. From Test B, make a response (RFILE=) file.
; This file is EXAM10B.TXT
TITLE="Analysis of Test B"
RFILE=EXAM10BR.TXT ; The constructed response file for Test B
NI=20
ITEM1=41 ; Items start in column 26 of reformatted record
NAME1=1 ; Start of person label
NAMELEN=11 ; Length of person label
CODES="ABCD# " ; Beware of blanks meaning wrong!
KEY1=CDABCDBDABCADCBDBCAD ; Key in data record format
&END
BANK 21 TEST B 1
BANK 4 TEST B 2
BANK 22 TEST B 3
.
BANK 35 TEST B 20
END NAMES
Person 01 B BDABDDCDBBCCCCDAACBC
.
Person 12 B BADABBADCBADBDBBBBBB
The RFILE= file, EXAM10BR.TXT, is:
Person 01 B 01110101011001000100
...
Person 12 B 00000001010000101000
III. Analyze Test A's and Test B's RFILE='s together:
; This file is EXAM10C.TXT
TITLE="Analysis of Tests A & B (already scored)"
NI=35 ; 35 items in total
ITEM1=31 ; reformatted data record
CODES=01 ; scored right-wrong.
; Blanks ignored as "not administered"
MFORMS=* ; multiple data files in different formats
DATA=EXAM10AR.txt ; first file
L=1 ; one line per data record
P1-11 = 1 ; person id starts in column 1 of input file
I1=33 ; item 1 is Test A's item 3 in Test A's column 33
I2=31 ; item 2 is Test A's item 1 in column 31
I3-5=37 ; items 3-5 are Test A's items 7-9 starting in column 37
I6=32
I7-9=34
I10-20=40
#
DATA=EXAM10BR.txt ; second data file
L=1
P1-11 = 1 ; person id starts in column 1 of input file
I1-3 = 34 ; items 1-3 are Test B's items 4-6 starting in Test B's column 34
I4 = 32 ; item 4 is Test B's item 2 in column 32
I5 = 41 ; items 5 in Test B's item 11 in column 41
I21 = 31
I22 = 33
I23-26 = 37
I27-35 = 42
*
&END
BANK 1 TEST A 3 B 4
...
BANK 35 TEST B 20
END NAMES
The combined data file (which can be accessed from the Edit pull-down menu) is:
Person 01 A 00001000010010001001
...
Person 12 A 00100001100001001011
Person 01 B 10111 010101001000100
...
Person 12 B 00000 000101000101000
After running EXAM10C, I want to see two ICCs: One for test A and another Test B. How do I do this?
This graph is not produced directly by Winsteps, but can be produced in Excel.
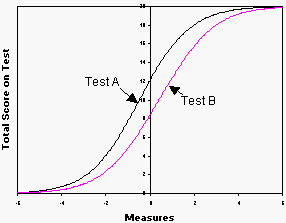
After the Exam10C analysis,
use the "Specification" pull-down menu to delete items not in Test A: Use IDELETE=21-35
Display the Test Characteristic Curve
Select "Copy data to clipboard".
Paste into an Excel worksheet
Use the "Specification" pull-down menu to reinstate all items: IDELETE=+1-35
Use the "Specification" pull-down menu to delete items not in Test B: Use IDELETE=6-20
Display the Test Characteristic Curve
Select "Copy data to clipboard".
Paste into an Excel worksheet
In Excel, scatterplot the pasted columns.