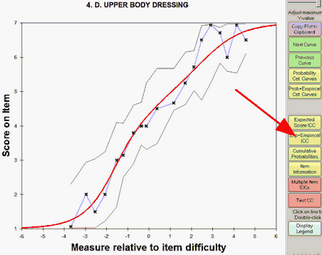
This shows the joint display of the expected and empirical ICCs. The boundary lines indicate the upper and lower 95% two-sided confidence intervals (interpreted vertically). When an empirical point lies outside of the boundaries, then some unmodeled source of variance maybe present in the observations. Double-click on a line on this plot to remove it from the display.
The solid red "model" line is generated by the relevant Rasch model. For a test of dichotomous items, these red curves will be the same for every item.
The empirical blue line is interpolated between the average ratings in each interval along the variable, marked by x. The empirical ("x") x- and y-coordinates are the means of the measures and ratings for observations in the interval. The display of the blue line and the x's is controlled by the Points button.
The upper green line (and the lower grey line) are at 1.96 model standard errors above (and below) the model "red line", i.e., form a two-sided 95% confidence band around the model red line. The vertical distance of these lines from the red line is determined by the number of observations in the interval, not by their fit.
Buttons are described in Graph window.