Select by clicking on "Multiple Item ICCs" in the Graphs window or from the Graphs menu. This enables the display of multiple model and empirical ICCs on the same graph.
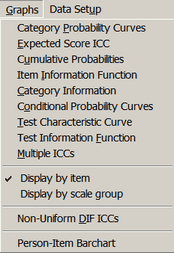
On the Graphs pull-down menu, please check "Display by Item"
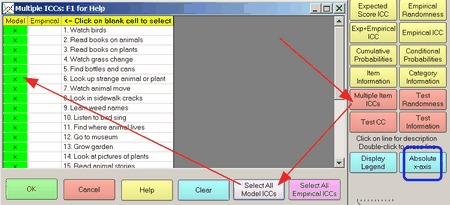
Click on the "Model" and "Empirical" curves you wish to display. Click again on your selection to clear it. Click on "OK" to display the curves.
Buttons are described in Graph window. The x-axis can use absolute scaling relative to the latent trait (as in this Figure) or scaling relative to each item difficulty.
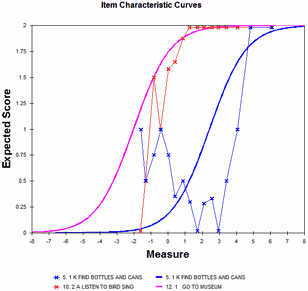
Displayed are the selected model and empirical ICCs. A similar technique is used to display DIF item characteristic curves for non-uniform DIF.
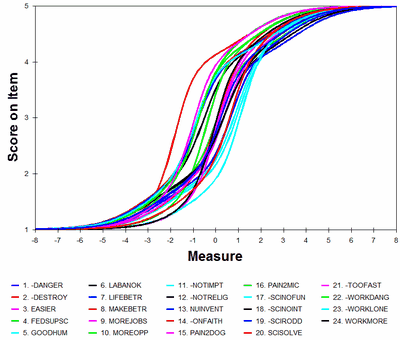
Example: Partial credit ICC's - ISGROUPS=0
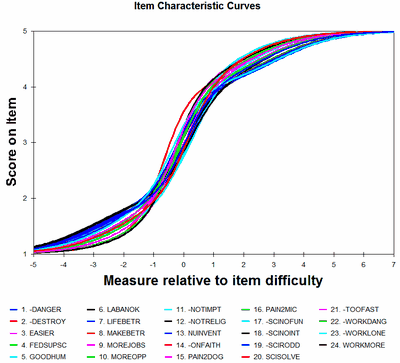
"Graphs" window, "Multiple-item ICCs", "Select All Model ICCs", OK
"Absolute x-axis": Model ICCs with absolute scaling relative to the latent variable = shown with item difficulties. The item difficulties spread out, but comparing the slopes of the ICCs is not easy.
"Relative x-axis:" Model ICCs with relative scaling, relative to the item difficulties. The item difficulties are set to 0, so that comparing the slopes of the ICCs is easy, but comparing the difficulties of the items is impossible.