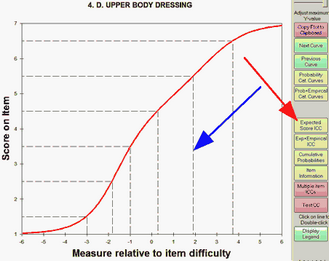
Select by clicking on "Expected Score ICC" or from the Graphs menu. Expected Score ICC plots the model-expected item characteristic curve, also called the Item Response Function, IRF. This shows the Rasch-model prediction for each measure relative to item difficulty Its shape is always ascending monotonic. The dashed lines indicate the Rasch-half-point thresholds correspond to expected values of .5 score points. The intervals on the x-axis demarcated by dashed lines are the zones within which the expected score rounds to each observed category. To remove the dashed lines, double-click on them.
The plot is of the "model item characteristic curve (ICC)" , also called the " item response function (IRF)". This is used for inference. If we know the score on the item, we can infer the ability of the person responding. If we know the ability of the person responding, we can infer the expected score on the item.
(difficulty of item + person's score on the item on y-axis) -> person's ability on x-axis
(person's ability on x-axis - difficulty of item) -> expected score on the item on y-axis
Item discrimation: the item is more discriminating where the ICC is steeper, and less discriminating where the ICC is flatter.
Buttons are described in Graph window.